How to Use Gann Pressure Dates to Profit in the Stock Market in 2025?
Introduction: Welcome to our in-depth guide to Gann Pressure Dates for 2024 onwards! You’ve come to the correct spot if you’re a trader, an investor or just curious about the fascinating world of financial markets. In this post, we’ll examine Gann Pressure Dates for the Nifty, their significance, and how to calculate them. We will also discuss the potential influence of Gann Pressure Dates on market movements and how to use this powerful tool to make educated judgments.
Section 1- Understanding Gann Pressure Dates
What are Gann Pressure Dates?
W.D. Gann, a great trader and analyst, pioneered the notion of Gann Pressure Dates. Certain precise dates, according to Gann’s beliefs, have a higher likelihood of influencing large price moves in financial markets. These dates are thought to produce “pressure points” in markets, where significant reversals or trend shifts are more likely.
The Significance of Gann Pressure Dates
Gann thought that the inherent principles that control financial markets are cyclical and that they can be forecast using a variety of mathematical and geometric methodologies. Traders can get an advantage in their trading techniques by detecting Gann Pressure Dates, which allow them to foresee probable turning moments and market movements.

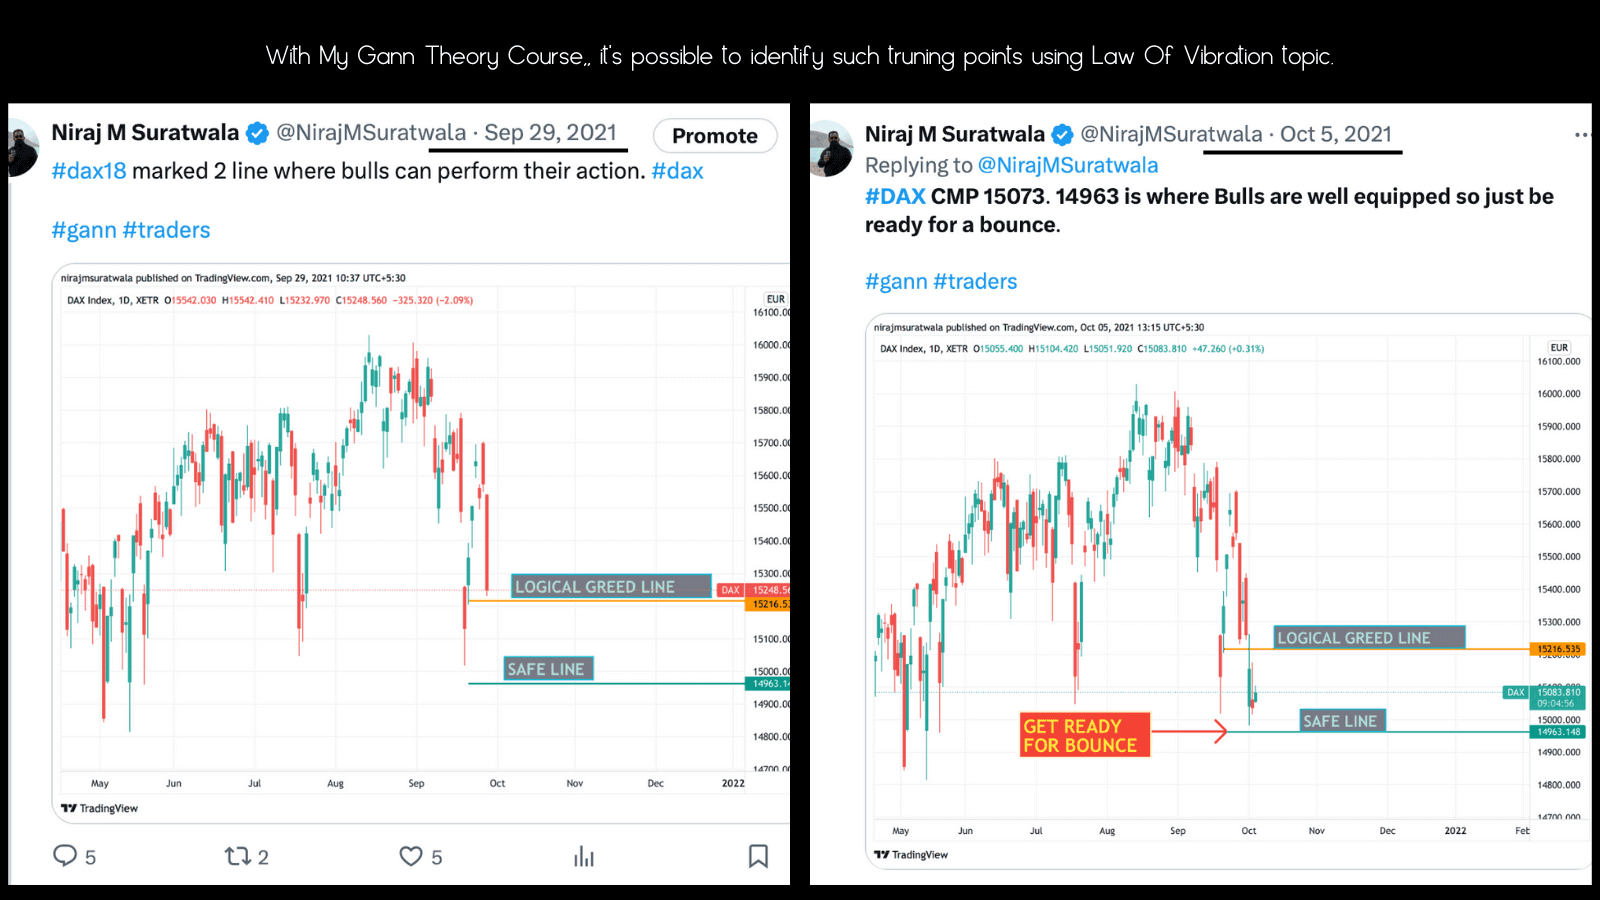
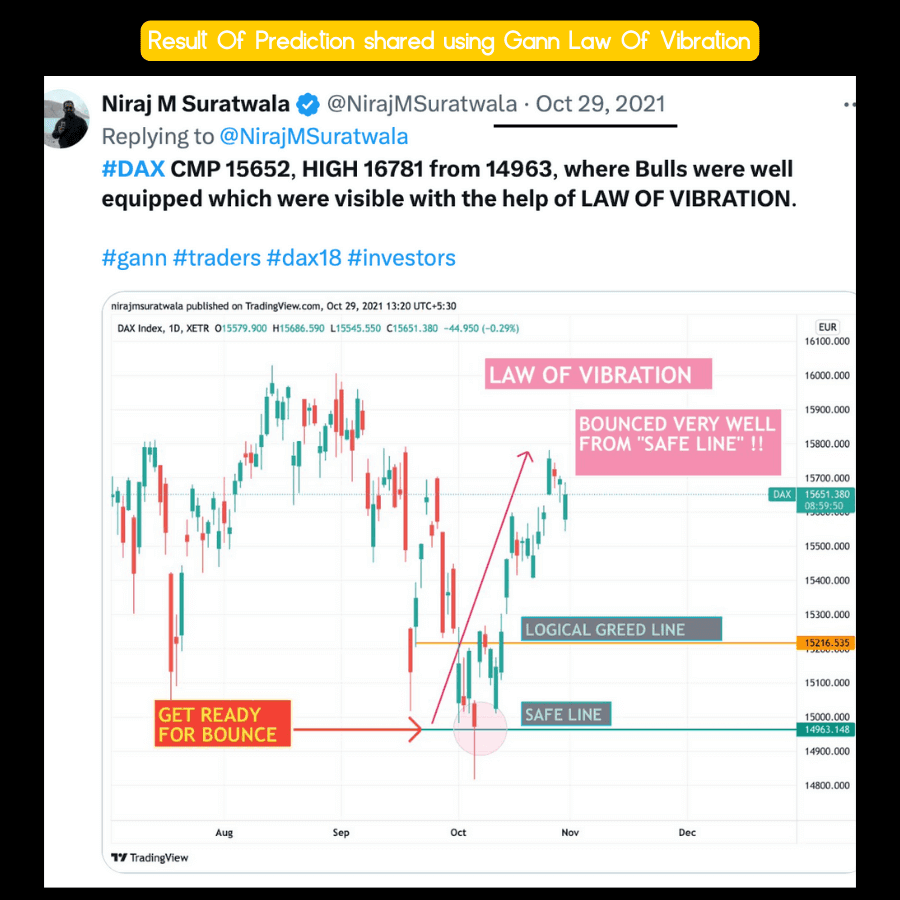
1. Example of benefits of Gann pressure dates on Dax
In this case, my Gann Theory course content such as pressure dates as well as law of vibration has helped to identify such turning points as shown in image (refer below attached image of Dax)
2. Recent Most Example 2024

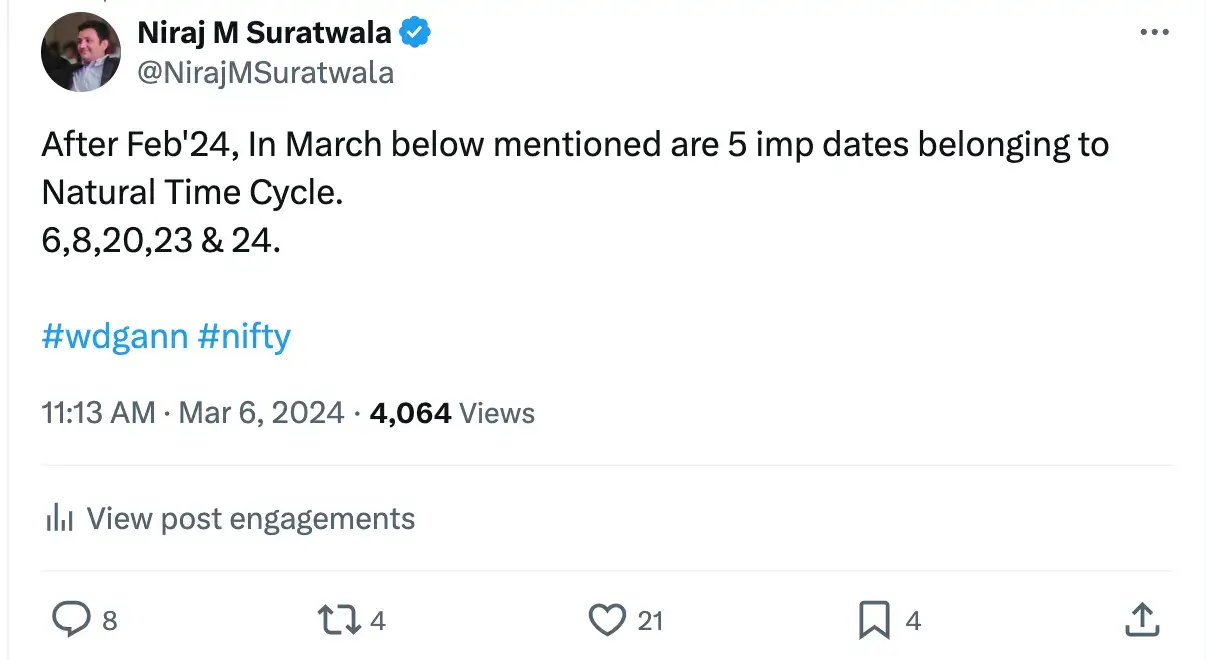
For 6 & 8 March’24:
We considered 7/3/24 as the right Gann Pressure date as 8/3/24 was a trading holiday, and mathematically, 7/3/24 was the only nearest point from 8/3/24.
For 20/3/24:
There was not confusion as it was a trading day,
For 23 & 24 March’24:
We considered 22/3/24 as the right pressure date, as 23 & 24 were both trading holidays.
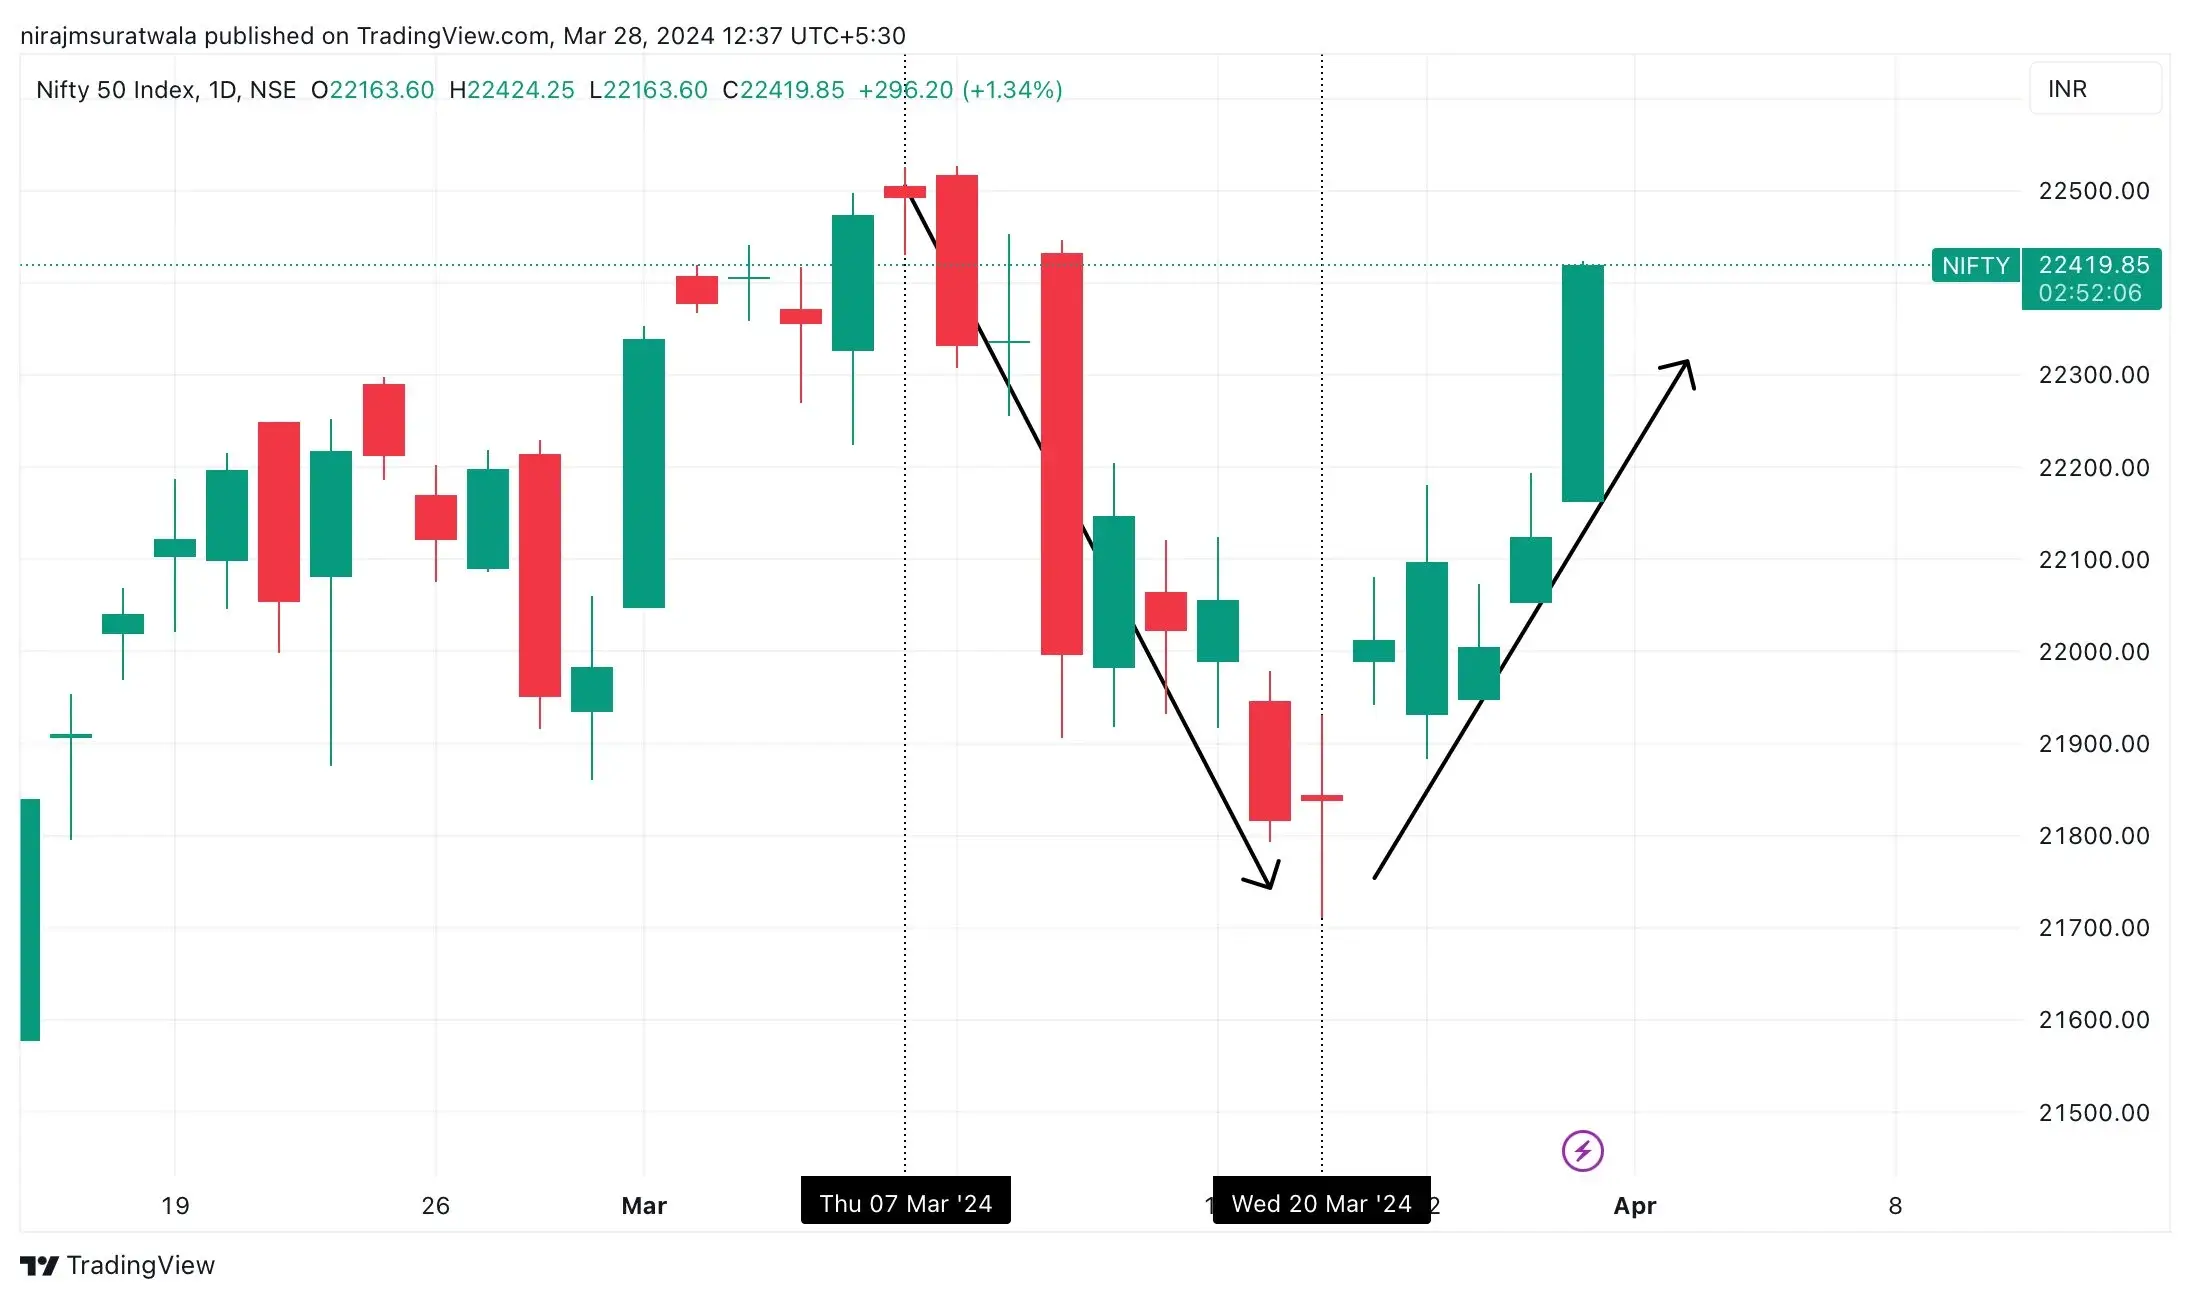
Trade Details:
On 6/3/24, shared all important Natural Time Cycle (NTC) dates on Twitter. 8/3/24 (NTC date), which was a trading holiday, so we considered its nearest mathematical point, i.e. 7/3/24.
A. On 11/3/24, we got confirmation of a bearish view,
B. On 12/3/24, we could discuss the opportunity and could encash 6.5 lakhs.
Click 👉Gann Pressure Date 2024
C. On 13/3/24, again traded for our right bearish view, which could have helped us to gain 15 lakhs!
Click 👉 Reference thread of 13/3 trade
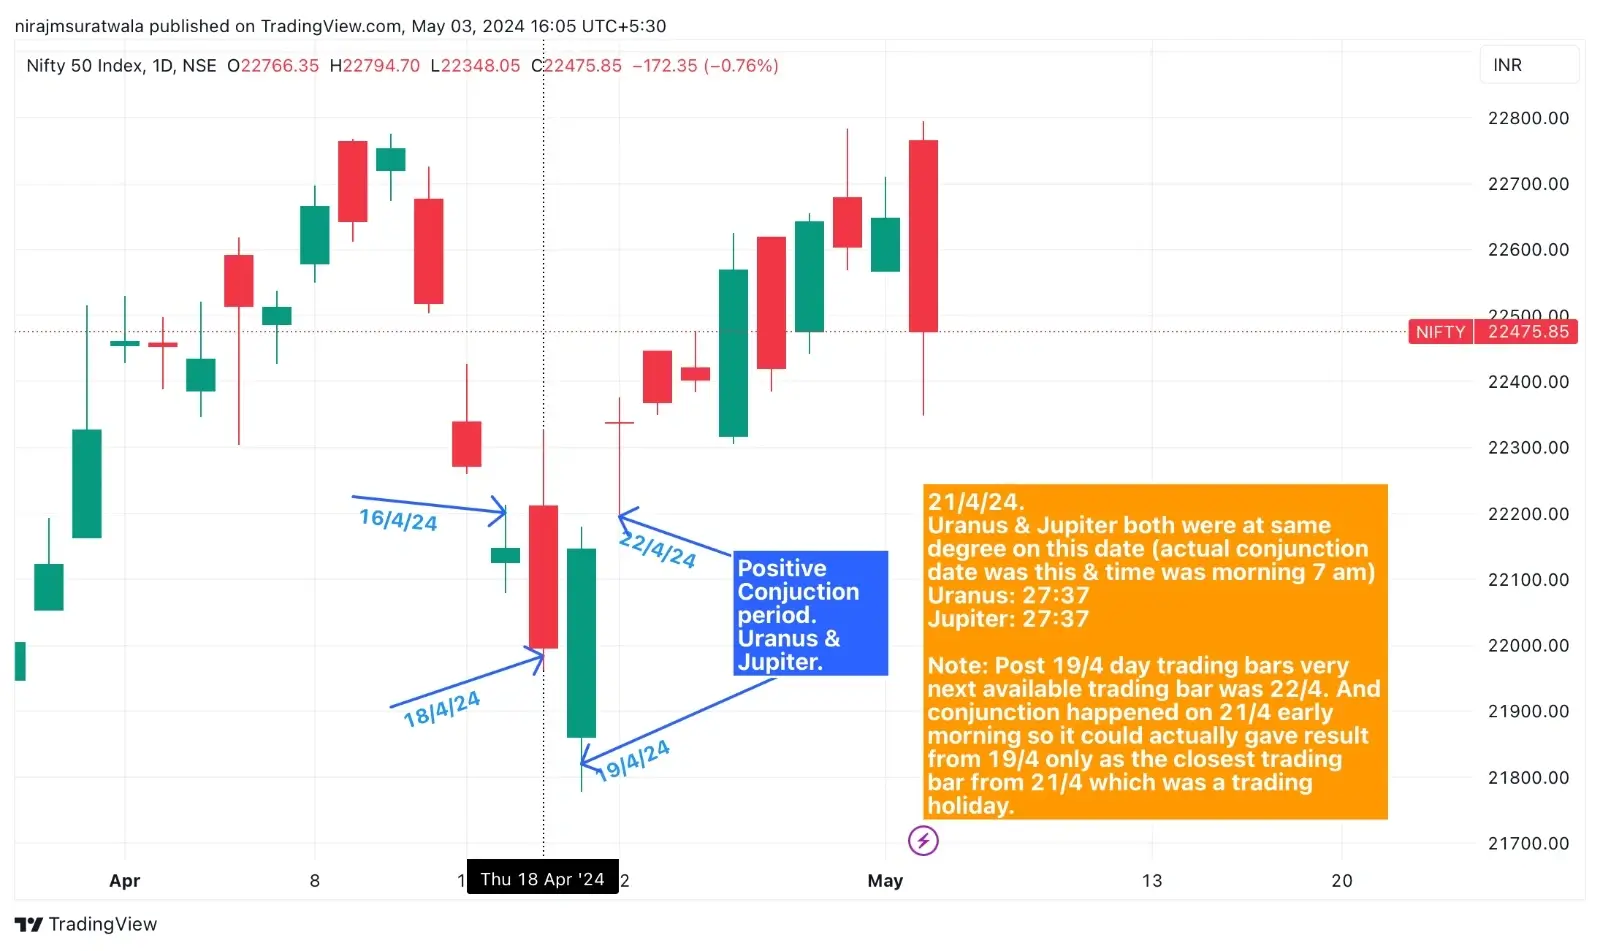
2. How we were prepared for a turnaround in Nifty from 22/4/24
Reference Image 1:
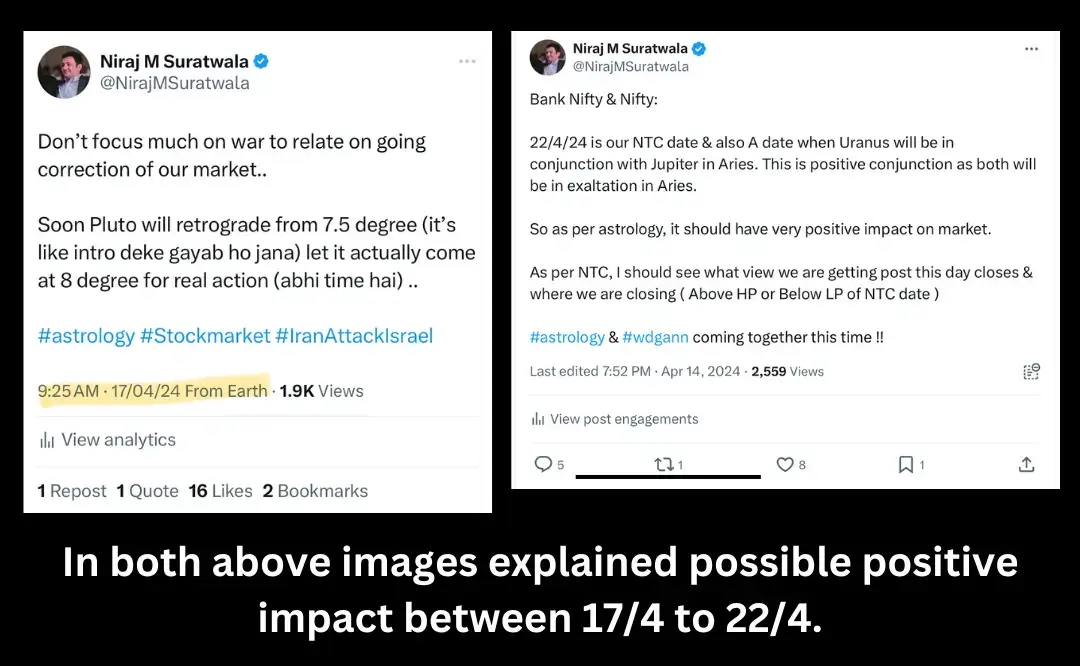
Image 2: Read this image very carefully, especially what is written on the price chart in the yellow background. Also, have shared an image after this showing Uranus and Jupiter were at the same degree in the same Rashi.

Watch this video where I am personally explaining whole threads of Nifty predictions made by using pressure dates, law of vibration and other important topics of the course:

3. Example Of Effect Gann Pressure Dates For Nifty
On 13/3/23, I could analyse that Nifty 50 can rise by 900 points from the 24/3/23 date.
And it happened as it was expected!
Click 👉 Gann Pressure Date 2023 Result
Section 2- Gann Pressure Dates in 2023
Why Focus on Gann Pressure Dates in 2023?
The year 2023 gives a once-in-a-lifetime chance for traders and investors to investigate Gann Pressure Time. As financial markets develop, it becomes increasingly important to rely on historical patterns and tried-and-true approaches like Gann’s to remain ahead of the game.
Gann Solar Dates
The idea of Gann Solar Dates is an important part of Gann Pressure Time. These dates are estimated based on the sun’s and planets’ positions and their probable effect on market movements. Traders may pinpoint Gann Solar Dates with amazing precision using modern astronomical methodologies, adding a vital dimension to their trading decisions.
Example Of Gann Solar Dates:
- First, divide the whole 365 days by 360 degrees to get the exact value of 1 degree equals 1 day. You should get 1.014 value after dividing 365 by 360 degrees.
- Now, this 1.014 value is to be multiplied by 30, 45, 60, 120, 135, 144, 180, 210, 216, 225, 240, 270, 315, 330 and 360. As a result, you will get values as shown in the Excel file below in “Adjusted Degree”.
We may add these “adjusted degree” values to any major high or low date of swing, e.g. here I have taken 19/10/21 as a major high in Nifty 50. Once we add “adjusted degree” values to 19/10/21, we get dates, such as 18-Nov, 4-Dec, 19-Dec, etc., as visible in below Excel file chart below. Such dates can be termed as “Level Candles”.
| Degrees | Adjusted Degree | Days | Swing High Dates |
| 19-Oct-21 | |||
| 30 | 30.42 | 30 | 18-Nov-21 |
| 45 | 45.63 | 46 | 04-Dec-21 |
| 60 | 60.84 | 61 | 19-Dec-21 |
| 90 | 91.26 | 91 | 18-Jan-22 |
| 120 | 121.68 | 122 | 18-Feb-22 |
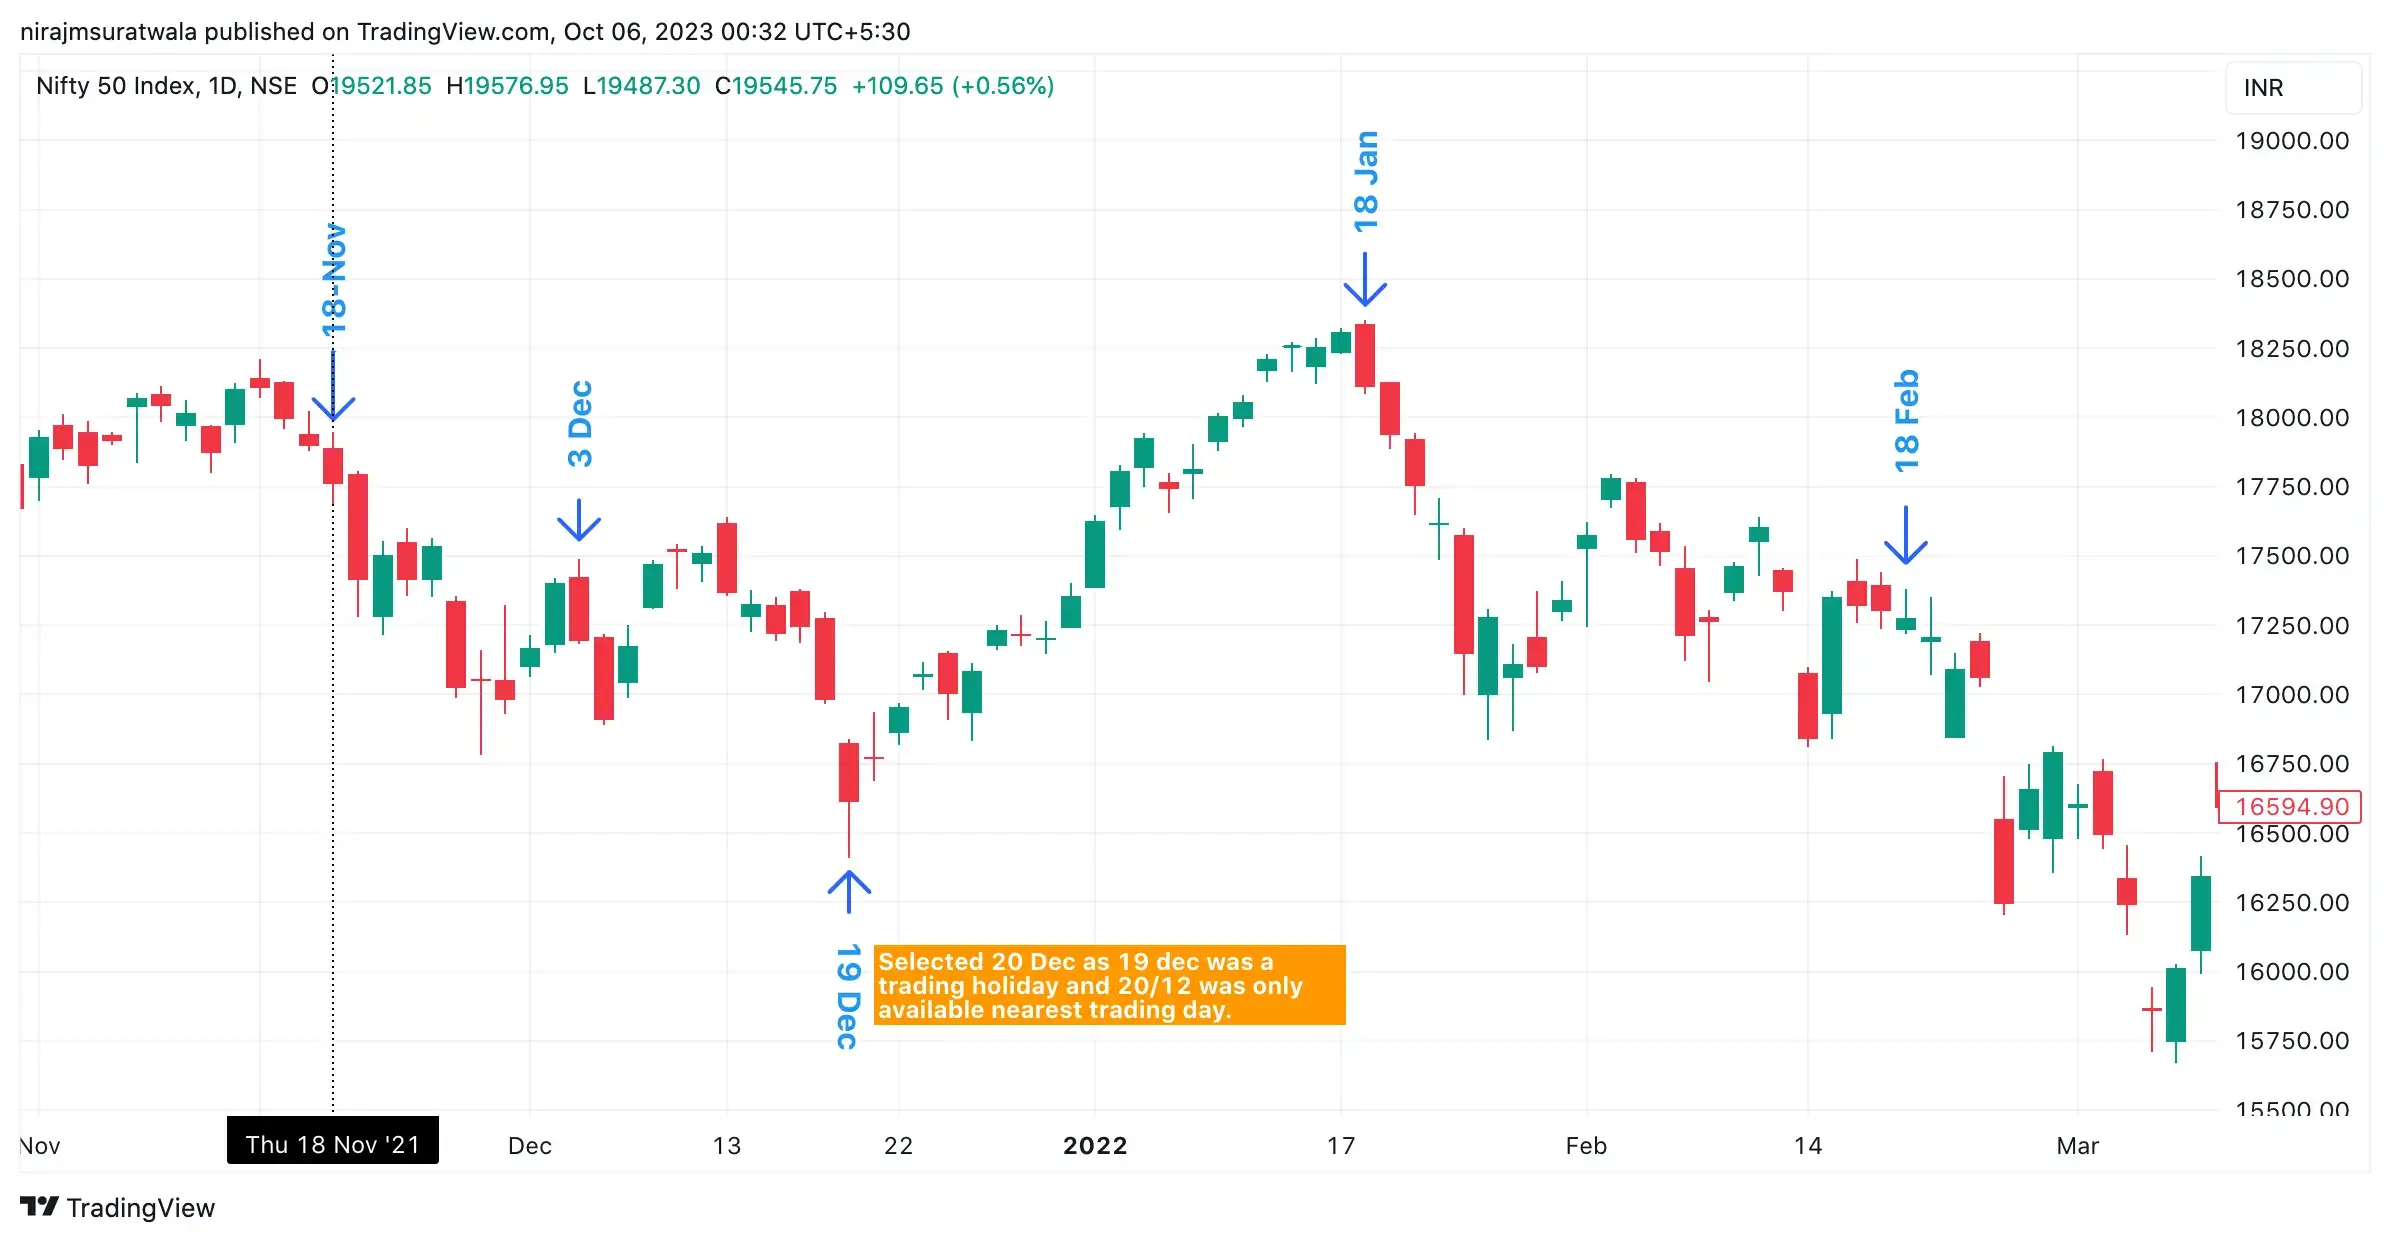
Now, how to use these dates, such as 18/11, 19/12, etc.?
1. Let the level candle close first. Once it closes the market, its high and low prices,
2. If any subsequent day closes above, consider that the market should have a bullish trend.
3. Similarly, if on any subsequent day closes below the level candle’s low price, it results in a bearish trend most of the time.
Point to be noted: When there is a trading holiday on a level candle, in such a case, either you should take the nearest trading day, e.g. 1-1-21 is your level candle and available trading days are 31-12-21 and 3-1-21. In such a case, 31-12-21 has to be considered as a right level candle. Some times gap between a level candle and 2 different available trading days is the same, e.g. 1-1-21 is your level’s candle and available trading days are 31-12-21 and 2-1-21. In such, I consider the nearest trading date, i.e. 31-12-21, as a right level candle.

Section 3- How to Calculate Gann Pressure Dates
Astronomical Analysis
Calculating Gann Pressure Dates necessitates astronomical investigation and the identification of relevant planetary positions. Traders can utilise a variety of software tools and web resources to precisely predict these astronomical phenomena.
Numerical Techniques
Gann’s work frequently used mathematical analysis and geometric patterns. Traders can identify probable Gann Pressure Dates within a specific period by using mathematical approaches and chart analysis.
Historical Data
Another way to compute Gann Pressure Time is to examine historical pricing data for repeating patterns and linkages with astronomical phenomena.
Section 4- Utilising Gann Pressure Dates for Trading
Timing Your Trades
Gann Pressure Dates are an outstanding trading time tool. Traders can boost their chances of detecting big market reversals or trend continuations by matching their trading tactics with these crucial dates.
Confirmation with Other Indicators
While Gann Pressure Dates can be effective on their own, combining them with other technical indicators can help you make better trading decisions. The combination of Gann Pressure Time with other indicators, like as Gann Law Of Vibration, Price Time Square, Gann Angles and Natural Time Cycle can improve the overall accuracy of your trading recommendations.
Risk Management
Risk management is essential in every trading plan. While Gann Pressure Dates provide useful information, they are not perfect. Using risk management tactics like as stop-loss levels and position size helps safeguard your funds from potential losses.
Student’s experience of analysing GANN Pressure dates post learning GANN theory course, known as the best online trading course:
Section 5- Gann Pressure Dates Case Studies
The Bull Run of DB Corp Ltd Stock
In this case study, we’ll look at how Gann Pressure Time correctly anticipated a substantial uptick in a popular stock. Traders may have gained from this bullish trend by aligning with the Gann Pressure Date.
Click 👉 Real Example
The Market Reversal of the Nikkei Index
This example shows how Gann Pressure Time predicted a market turnaround in a major stock index. Traders who followed the Gann Pressure Time were better positioned to exit long positions and benefit from the subsequent drop.
Click 👉 Real Example
Section 6- Conclusion
Finally, Gann Pressure Time provide traders with a unique and strong tool for anticipating probable market turning events and improving their trading techniques. Traders can obtain a competitive advantage in the volatile world of financial markets by knowing the significance of these dates and how to calculate them. As we approach 2023, it is critical to analyse the historical significance of Gann’s theories as well as their current use in the present trading arena. Whether you are a seasoned trader or a new investor, using Gann Pressure Dates in your trading arsenal will help you make more educated and lucrative selections.
Take the time to learn about Gann Pressure Time, try out different techniques and remember to integrate them with effective risk management procedures. You’ll be better equipped to handle the financial markets with confidence and maybe uncover hidden possibilities for success if you have this information and a disciplined approach. Begin your adventure into the realm of Gann Pressure Dates now and watch your trading activities become more precise and foresighted. Remember that markets are always evolving and Gann’s timeless concepts may hold the key to unlocking their riddles in 2023 and beyond. Good luck with your trade.
Read More:
How To Trade In Nifty 50
Bank Nifty Tomorrow Prediction
Gann Time Cycle
Gann Cycle Decoder