By Niraj M Suratwala, Mentor for Gann Trading Course.
With over 15 years practicing WD Gann Theory in stock markets, yielding impressive results, and 10 years of mentoring aspiring traders, I’ve predicted numerous turning points of the market in sequence! Shared publicly on this site, X (Twitter), YouTube, LinkedIn, and WhatsApp. These serve as verifiable proof of its real-world power. My expertise comes from rigorous analysis, teaching hundreds to thrive in volatile markets.
Hello! Welcome to my site, sharing practical insights on advanced trading, focusing on WD Gann Theory. Immersed for 15+ years, I’ve witnessed its transformative impact.
In this 2025 guide, discover the truly worthwhile online WD Gann course for beginners and pros. Explore core principles, modern applications, and why it boosts prediction accuracy and confidence in stock trends.
Learn Gann Course (Trading Course) To Have A Successful Decade In Stock Market!

So, what exactly is Gann Theory?
My Gann Time Cycle Course introduces a powerful trading methodology known as Gann Theory, developed by the legendary trader WILLIAM DELBERT GANN. Renowned for mastering the art of stock market forecasting, Gann utilised innovative techniques such as time cycle analysis, geometry rooted in natural laws, and astronomical mathematics.
He firmly believed that successful trading required skilfully integrating the X-axis (Time) and Y-axis (Price) to predict market movements accurately.
Welcome to my website, where I share expert insights into Gann Theory trading. I’ve designed this course to make Gann Analysis simple, practical, and accessible for traders of all levels. Here, you’ll learn how to apply these time-tested techniques to the stock market, forex, and other tradable instruments through clear, real-world examples.
Explore my course to discover how William Delbert Gann’s techniques can enhance your trading decisions. Start mastering stock market forecasting today with practical tools and strategies tailored for success.
Why should you learn this trading course?
(Time Analysis / Timing stock market)
A. Important Reminder Before Learning the Gann Time Cycle Course:
Many people attempt to time their trades or investments using technical analysis. However, this approach seems unfounded to me, as nearly 99% of technical studies rely solely on price data, which is plotted on the Y-axis of a chart. Surprisingly, the X-axis, which represents time, is often overlooked—even by over 300 different technical studies.
To truly understand time analysis in trading, one must learn the Gann Theory Course—a comprehensive course that addresses this critical aspect of market analysis.
B. Why Learn Gann Analysis?
Fundamental analysis is essential for selecting the right company. However, once you’ve made your choice, you also need to determine the best time to buy. Here’s the catch: no matter how good the company is, if you enter at a high valuation, your future CAGR may not be very attractive. Therefore, it’s crucial to have a reliable method for deciding at what price and at what time you should enter the market.
This is where the Gann Analysis Course becomes valuable.
To determine the ideal entry price, a valuation process is usually required to assess whether a stock is overvalued or undervalued. Typically, this involves extensive fundamental research, which is time-consuming.
Alternatively, you can address the “at what price to enter” question by applying the WD Gann Trading Theory. This approach is simpler, faster, and equally effective.
How is this highly reliable WD Gann course in India?
Now, let me tell you about the online Gann analysis course I teach to individuals and businesses – the WD Gann Trading Techniques Course. This comprehensive course is designed for ambitious traders and investors who want to master the Gann theory and apply it to their trading and investing strategies. I offer a step-by-step guide to understanding the theory and implementing it effectively in real-life trading scenarios.
One aspect that sets this course apart from others is its focus on simplicity and easy-to-understand language. I believe trading and investing concepts can often be complicated and intimidating, especially for beginners. Therefore, I have ensured that the course breaks down Gann theory into digestible pieces, making it accessible to traders of all levels.
Gann Trading Course Content: No Noise, Only effective topics are covered in the course.
Gann Natural Time Cycle,
How Gann Law of Vibrations works on every tradable instrument,
Gann Price Time Square,
How to use the Gann Circle by converting important Degrees into Price & IMP Price Levels into Degrees and
Use Of VIX
Trading using Gann Angles
Mode of Gann Theory Course:
Class Format: Live Online (One-on-One)
Duration: 7 sessions over 4 weeks
Each Session: Up to 2 hours
Each concept is explained clearly and concisely, enabling traders to grasp the essence of the theory without feeling overwhelmed.
I also provide practical examples and real-life case studies, which further enhance the learning experience.
I have designed this course in a way that allows traders to develop a solid foundation before moving into more advanced concepts. This progression ensures that traders gain a comprehensive understanding of the theory and its practical applications.
Moreover, the course offers interactive elements and assignments, allowing investors and traders to test their knowledge and apply the concepts they have learned. This interactive approach not only reinforces learning but also encourages active participation and critical thinking.
Key Insights into the Ultimate Gann Course in India
- The Reality: 90% of People Lose Money, but William Delbert Gann’s Concepts Help You Join The 10% Who Succeed!
- The Stock Market And Nature Share Similarities – Both Are Ever-Changing, Making Predictions Challenging.
- Change Is Inevitable, But Knowing The Starting And Ending Points Of The Upcoming Change Is Possible… Yes!
- The Concept Of WD Gann Theory Is A Lens Through Which You Can Analyze Future Changes. Learn This Method And Get Closer To Predicting Them.
- Traders, Your Struggle Is Timing –
Moving Object Price Is A Distraction! Focus On Time! - Learn The Gann Theory Course
(William Delbert Gann Trading Theory) And Master The Art Of Identifying Trend-Reversal Points. - WD Gann’s Methods Are Simple And Easy To Understand, Making Trading Life Much Easier.

Some Gann Predictions made on Nifty, Bank nifty & other tradable instruments using the subject
Nifty 50 Prediction for 13/3/23 to 13/4/23
On 13/3/23, I could realise that from 24/3/23, Nifty 50 can move upside for 900 points, and that successfully happened!
We can use the Law of Vibration to make such a prediction. This topic is an important part of my WD Gann Stock Market Course.
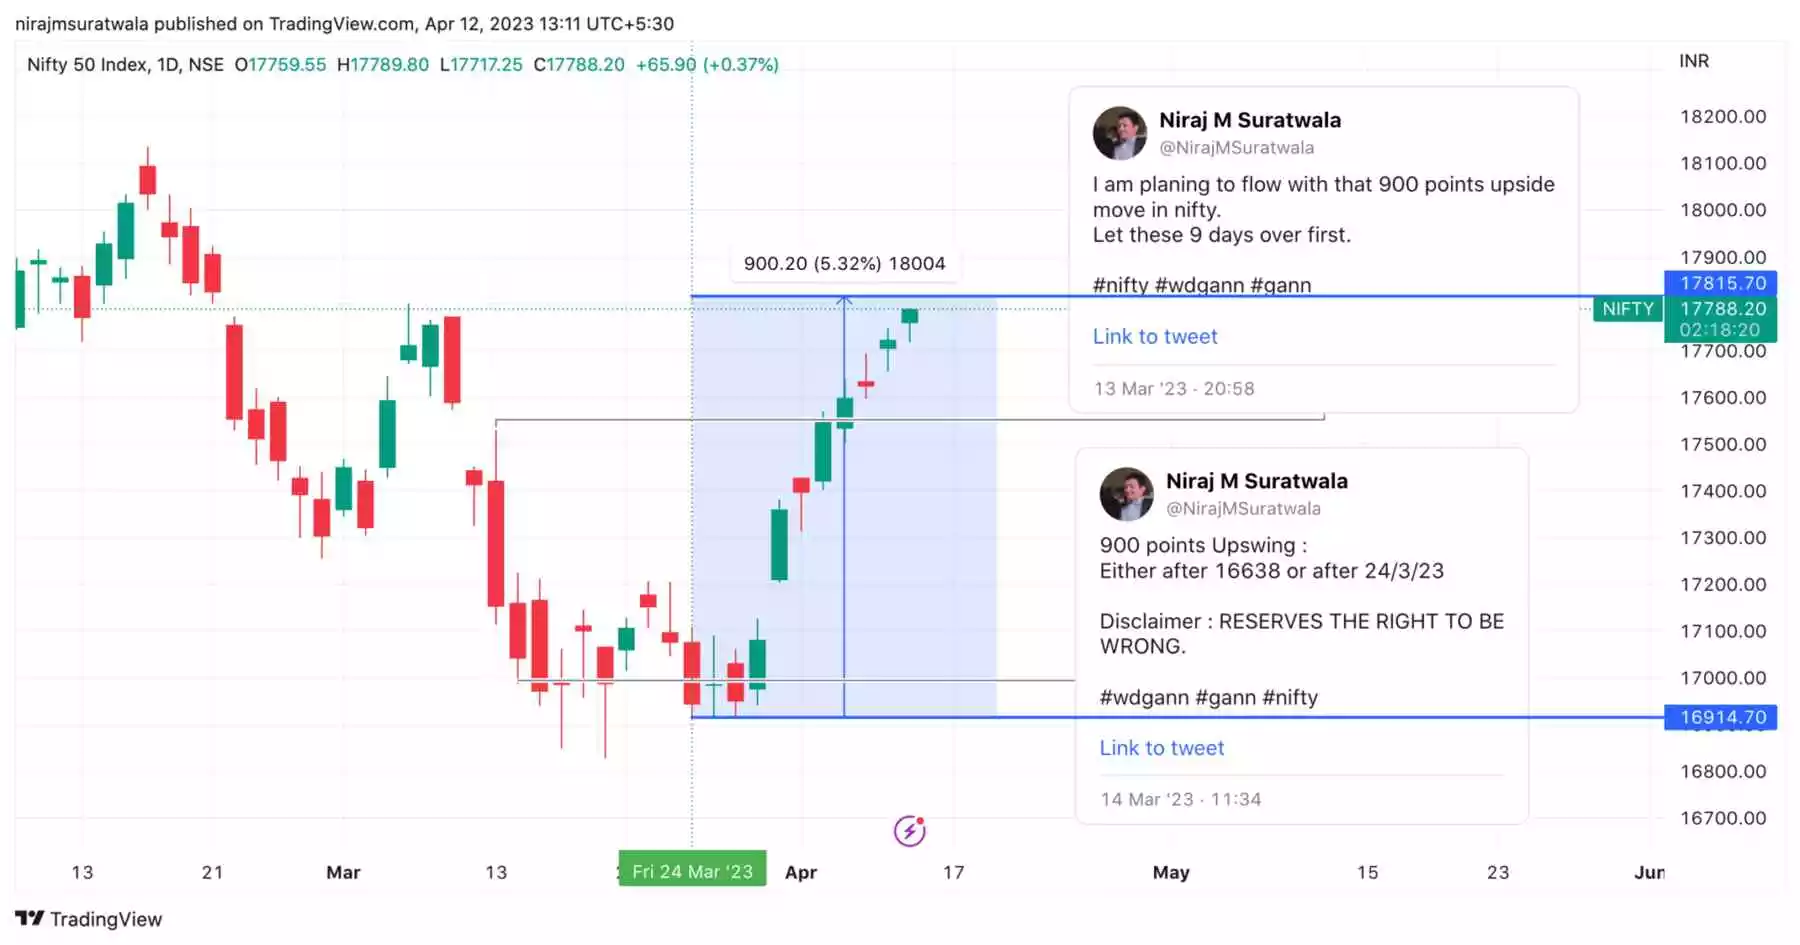
On 13/3/23, shared that post 9 days expecting 900 points rise & it started happening just right after the 9th day. In 4 days, 464 points have risen, and half is due. Gann Theory Course Content applied to Nifty 50 to predict the right time.


Case Studies
Out of the given course content, they have demonstrated their use by covering the majority of the topics.
Click button below to access information
Explained The Gann Time Cycle Course Below:
In my Gann Theory Course, I have covered the concept of the Gann Time Cycle. Let me explain a bit more about what the Gann Time Cycle is.
It is a well-known fact that history tends to repeat itself. However, the challenge lies in identifying which historical events will shape the future. In my Gann Course, we explore the Law Of Cause And Effect, which mathematically delves into the concept of the Nature Time Cycle. This helps us calculate the relationship between past events and future dates, providing us with dates that are crucial for predicting upcoming market trends.
The Gann Time Cycle is a key element in this course, and we explore its basic aspects to give you a deeper understanding. You can click on the image below for more details.
Gann Time Cycle (30 Years)
— Niraj M Suratwala (@NirajMSuratwala) June 20, 2022
Duration Of Word Timeline : 30Yrs
Instruments covered : Major Indian Indiceshttps://t.co/6Vl4z74M1n
Learn WD Gann Theory & Realise value of Time Cycle !
Traders can improve their Timings by Learning Gann !#wdgann #Time_cycle #gann #trading
Closing Thoughts
Undoubtedly, this WD Gann Trading Techniques course is the best Gann course for ambitious traders in 2025. It provides a comprehensive and user-friendly guide to successfully understanding and applying Gann theory. Emphasizing simplicity, practical examples, and interactive teaching, this course provides traders with the tools they need to operate with confidence in the financial markets.
So, join me on this exciting journey towards mastering the Gann theory and unleashing your trading potential. Together, we can delve deeper into the world of financial markets, armed with the invaluable knowledge and insights provided by W.D. Gann’s timeless theory.
Let’s make 2025 the year of successful trading!
FAQs
Q-1: What is Gann Trading Course?
Answer: Gann Trading Course is a trading program based on W.D. Gann Theory, also known as Gann Trading Theory, which is a unique approach employed by traders to anticipate patterns and price fluctuations in the stock market. This methodology was originally formulated by William Delbert Gann. His theory encompasses a comprehensive analysis of historical, current, and future market outcomes through the lens of Gann Angles. Moreover, Gann theory enables predictions of past value trends by leveraging the progression of angles.
Q-2: Who was William Delbert Gann?
William Delbert Gann was an influential American stock market trader, back in 1935. William Delbert Gann was also a 33 degree Freemason of the Scottish Rite Order.
Q-3: What is Gann used for?
Answer: For predicting right time or right price of entering into a trade.
Q-4: Was William Delbert Gann Involved In Intraday Trading?
Answer: Gann was also an intraday trader, but did not focus only on intraday trading.
Q-5: How accurate is Gann Theory?
Answer: Well, there is no foolproof method to trading success. Though, Gann theory course can be helpful for identifying potential turning points in the market. It is not 100% accurate and should be used in prudently with having a good risk management practice in place. Also, Gann trading rules are there to follow that helps in trading safely in stock market.
Q-6: Who should learn this Course?
Answer: Not only Gann course but any stock market course can be suitable for only those who has an another income source. The reason is, You have to wait till the right time and price. Now, until you don’t get that right time or price you have to wait and only those can wait who are not totally dependent on stock market income.
Q-7: In what ways does W.D. Gann Trading Theory contribute to profit generation in trading?
Answer: Gann Theory revolves around the idea of predicting price movements by analysing three fundamental principles. These principles are based on the belief that future price behaviour can be forecasted using specific techniques and observations. By understanding these principles, traders aim to make informed decisions in any tradable instruments, such as Stock Market, Bitcoin, Commodity etc
- Time: The first property examined in Gann Theory is time. According to this principle, the analysis of historical price patterns can reveal cycles and recurring trends. By identifying these patterns, traders can anticipate future price movements and determine optimal entry and exit points for their trades.
- Price: The second property studied in Gann Theory is price. This principle suggests that prices move in specific geometric patterns and ratios. These patterns can be identified using various tools, such as Gann angles, Gann Square Of 9, Levels we identify using Law Of Vibrations and Price Time Square method. By analysing these price patterns, traders can make predictions about future price levels and potential areas of support and resistance.
- Geometry: The third property analysed in Gann Theory is geometry. This principle states that price movements exhibit geometric relationships and proportions. Traders use various geometric tools. For example, Gann angles and squares, to identify these relationships and anticipate future price levels. By applying these geometric concepts, traders can determine potential turning points and project price targets.
Q-9: What advantages does W.D. Gann Trading Theory offer in the realm of trading?
Answer: By incorporating the Gann Angle into trading strategies, traders can gain insights into future market trends. This framework enables analysts to efficiently interpret market movements. When utilising this approach, the advantage of plotting Gann angles lies in their consistent rate of progression. This consistency empowers traders to make predictions about future price movements. Learning and implementing this strategy is highly beneficial for individuals aspiring to pursue a career as a stockbroker.
Gann Time Cycle Course Reviews
"A Course That Boosts Confidence & Market Understanding"
Neeraj Sir, thank you so much. The way you explained Gann concepts like Natural Time Cycle, Law of Vibration, and Price-Time Square was truly amazing. Even someone with no prior background can learn deeply from this course. You were always supportive and flexible with timing. I feel lucky to have taken this course—it has boosted my confidence and transformed my market view. Highly recommended to all serious learners.
Superb learning
Great learning from neeraj sir , Gann theory in such a simple mode with all mathematics made so simple that u can directly imply . Thanks sir
"Foundations of W.D. Gann Theory: Time, Price & Market Geometry"
Neeraj sir, thank you. The way you simplified and explained the concept of Gann Theory was very commendable. Anyone, whether new or old in the share market, can learn many things through this course and can take their knowledge and investment plan to a new height. Sir, you are very flexible with time, and you managed the time for me also, very well at many places. Sir, thank you for launching such a course. I am feeling blessed and so happy to take this type of course. I recommend people take this type of course, which raises their confidence to a higher level.
Response from WD Gann Theory Trader, Mentor & 5Elements Consultant
Thank you very much for keeping faith in the process and learning it patiently!
Disclaimer
Whatever Gann Course Content delivered to student is for educational purpose only. We recommend thoroughly understanding the strategies and exercising your own judgment. By this I mean, double check them in your backtesting before applying them in live markets. It is advisable to start with paper trades initially to gain practical experience. As a result, it shall refine your skills of using real capital in stock market.
Trading stocks or indices or commodity or any tradable instruments inherently involves market risk. Hence, users must exercise their own discretion when participating in live market trading. It is essential for individuals to understand the potential risks involved and make informed decisions based on their own assessment and analysis.
I, as the provider, cannot be held responsible for any losses or damages incurred by the student/client in any capacity. It is the individual’s sole responsibility to bear any potential consequences arising from their trading activities.
Please Note:
I do not provide investment advice: I do not recommend specific stocks, cryptocurrencies, or any other financial instruments.
Also not Offering any trading signals: I do not provide real-time or delayed trading recommendations.
And not involved in selling any financial products: I do not offer any financial products or managed trading accounts.