About Time:
Timing is everything in trading and investing. Time is often the most overlooked factor in the stock market, yet it is crucial for success. Regardless of the quality of the stock selected for trading or investment, failing to enter and exit at optimal times can severely impact returns on investment.
Who developed the time cycle concept? And who was that person?
During the 1920s, the legendary trader and investor William Delbert Gann, a 33rd degree Freemason, integrated the time element with price in his stock market analysis methods. He achieved remarkable success in his trading career by developing robust and profitable techniques. These approaches remain popular today and are collectively known as the W.D. Gann Theory.
W.D. Gann Theory incorporates intriguing elements such as geometry, ancient mathematics, astronomy, and astrology. Utilizing these principles, Gann developed key tools including Gann Time Cycles, the Gann Square of 9, the Gann Hexagon, the Gann Law of Vibration (also known as Octave Theory), Gann angles, and Price Time Squares.
W.D. Gann was born on June 6, 1878, in Lufkin, Texas. He started his trading career during the early 1900s and relocated to New York City in 1908, where he founded his brokerage business, Gann & Company. Through his unique method of technical analysis, Gann is said to have earned profits surpassing $50 million from financial markets!
About Gann Time Cycle:
W.D. Gann believed that recurring time cycles hold the key to forecasting shifts in the markets. These patterns vary in duration, from brief daily fluctuations to extended periods covering multiple weeks, months, or years.
At the heart of his approach lies the principle that history tends to repeat itself in financial trends, allowing traders to anticipate pivotal changes by examining historical rhythms.
Here, step by step, I will be sharing the application part of the Gann time cycle.
In the beginning, I am sharing the easiest/common and general method. Gradually, I will share the actual and most effective way of applying the real Gann time cycle concept. You may find that a little difficult too.
Using numbers and a combination of numbers in applying the Gann time cycle
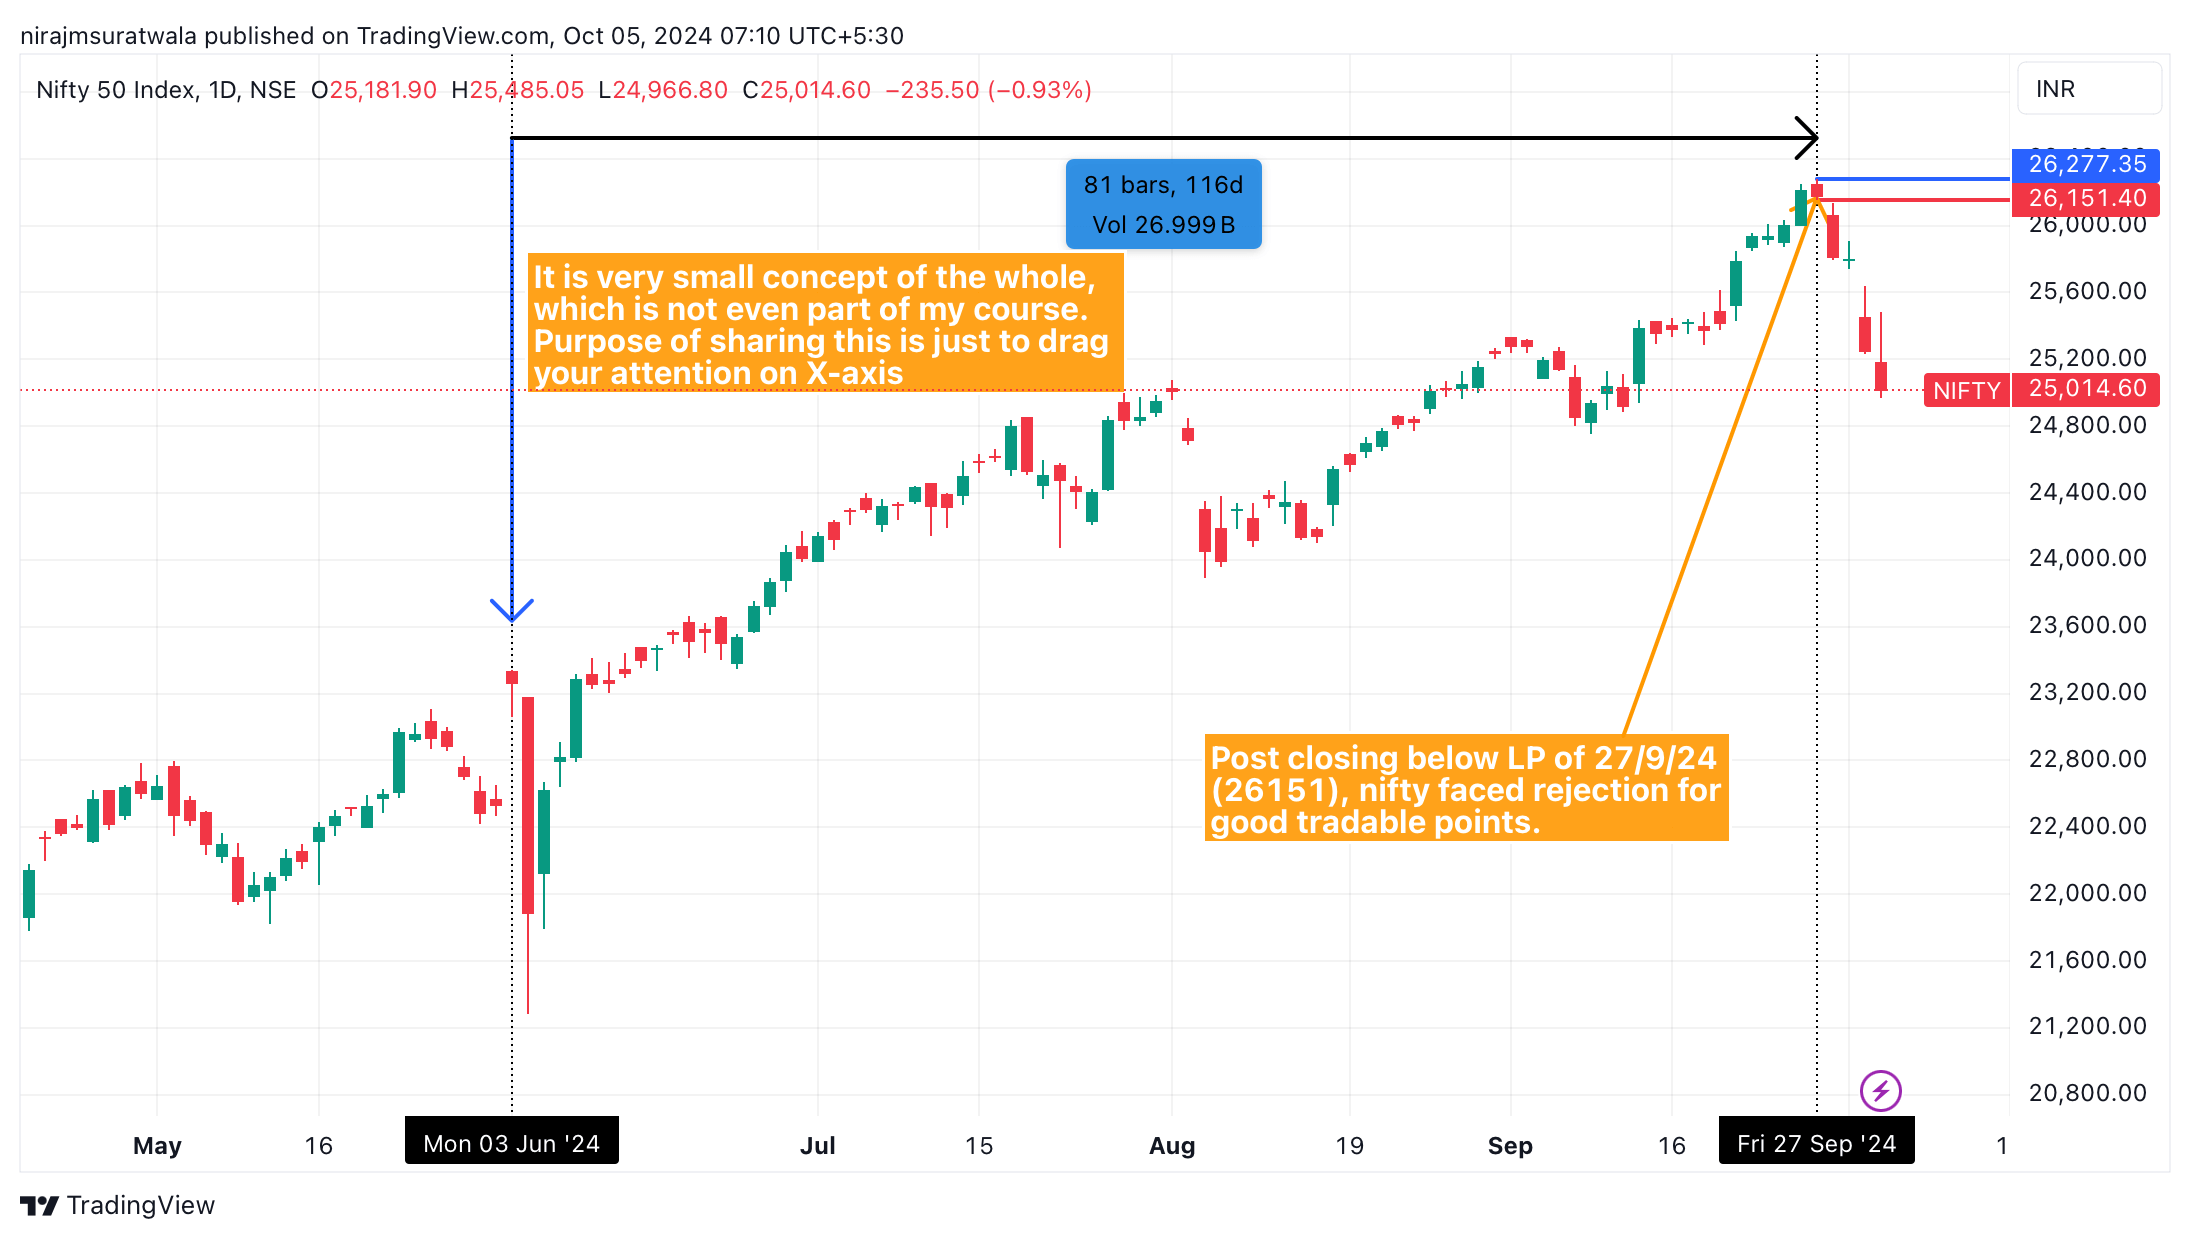
Using number 81 trading bars:
To apply Gann time cycles, select a specific top or bottom and add 81 trading bars to it. In the attached image below, I selected a significant top for a particular reason and added 81 trading bars. This resulted in the date of 27/9/24, from which I expect a change in trend. (Please read the attached image below carefully.)
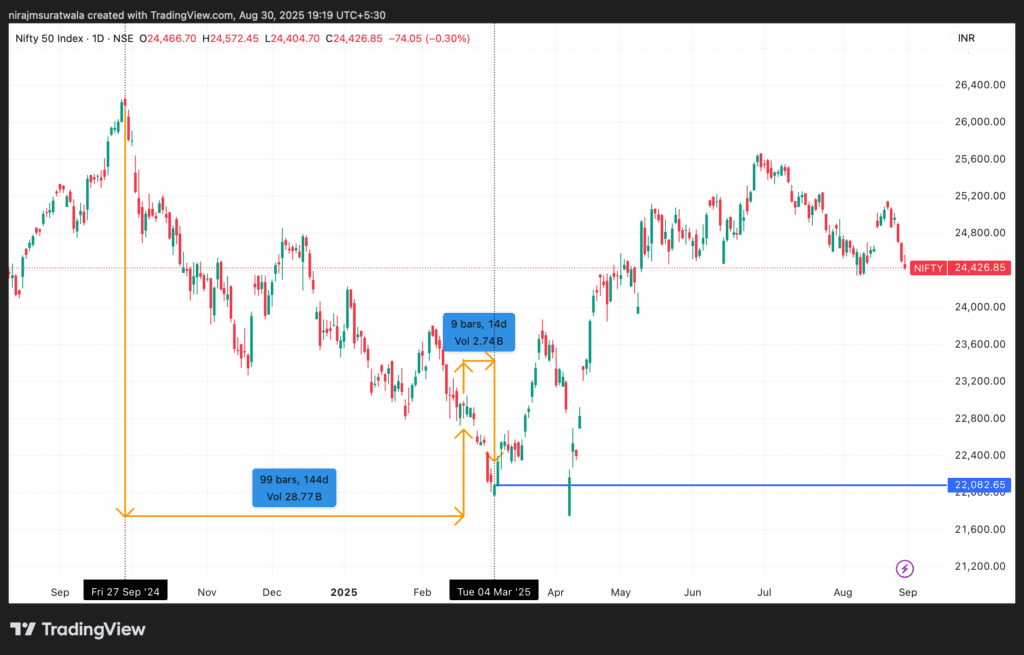
144 days & months cycle in the Gann time cycle:
Example A: Refer to the attached image below. I first selected a significant top on 27/09/24 and then added 144 calendar days, resulting in the date 18/02/25. From this date, I added 9 trading bars (the energy number), arriving at 04/0325 as an important Gann date. The closing price of this Gann date is very important. If the market closes above this closing price (22082) after this date, we can adopt a bullish view from that day onward-and vice versa.
On a monthly chart, you need to add 144 trading bars. Once added, mark the 144th candle’s high price and low price. If any monthly candle closes above the high price, the view should remain bullish. On the contrary, if any monthly price candle is closing below the low price, the view should remain bearish.
Example B: Refer to the attached image below.

Gann Seasonal Dates:
William Delbert Gann found a very interesting co-relationship between the occurrence of changes in the Stock Market and Nature. Yes, he believed that the change in seasons on Earth has some impact on the stock market as well. In nature, there are fixed dates when usually change occurs. These dates are mentioned below:
21st March: Spring Equinox
21st June: Summer Solstice
23rd September: Fall Equinox
21st December: Winter Solstice
To save your time, let me get straight to the application part rather than stretching long on the philosophy and theory part of this.
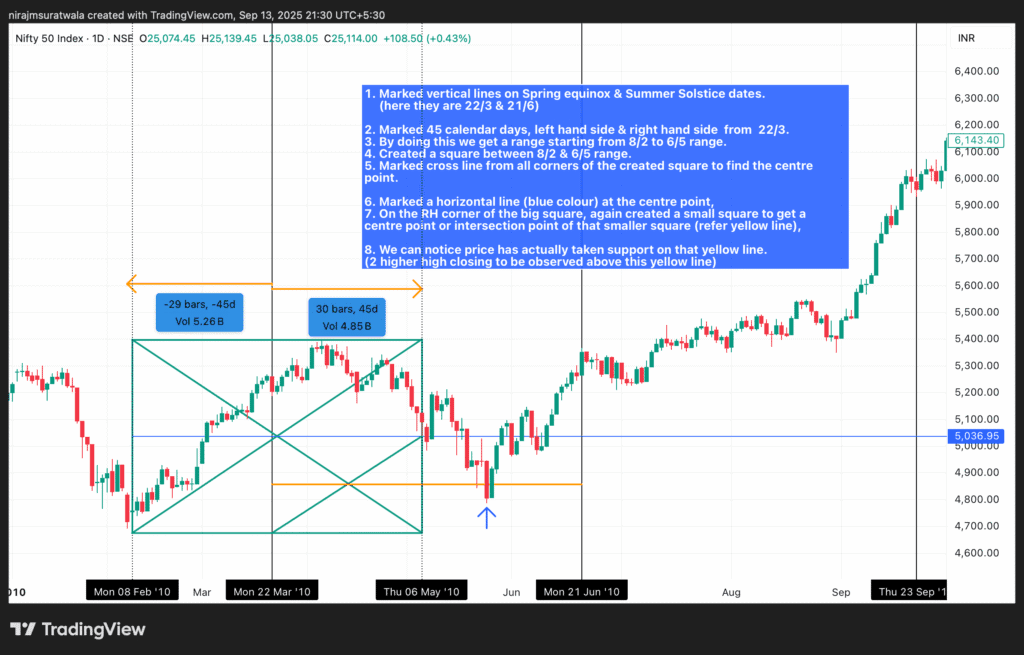
Here is a clearer, more structured description, presented as a step-by-step process of the actual application part of The Gann seasonal dates. Refer above image where the concept has been applied and explained each steps below:
- Draw vertical lines on the dates of the Spring Equinox (March 22) and Summer Solstice (June 21).
- From the Spring Equinox date (March 22), mark 45 calendar days to the left and 45 calendar days to the right.
- This creates a date range from February 8 to May 6.
- Construct a square spanning the date range from February 8 to May 6.
- Draw diagonal lines (cross lines) connecting all four corners of the square to identify the centre point.
- Draw a horizontal line (in blue) passing through the centre point.
- In the right-hand (RH) corner of the large square, construct a smaller square and draw its diagonals to find its centre or intersection point (refer to the yellow line).
- Observe that the price has taken support on this yellow line. (Note: Monitor for two higher-high closings above this yellow line.)
This way, we can find important support and resistance of any tradable instrument using the Gann seasonal dates.
Important numbers’ impact on the timeline from the tops and bottoms:
All major TOPs & Bottoms used to be within the range of 81,120,121 bars or 180,181,182 CalendarDays.
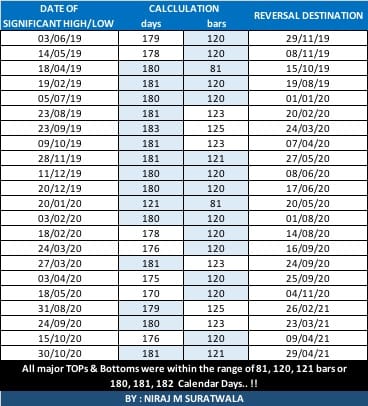
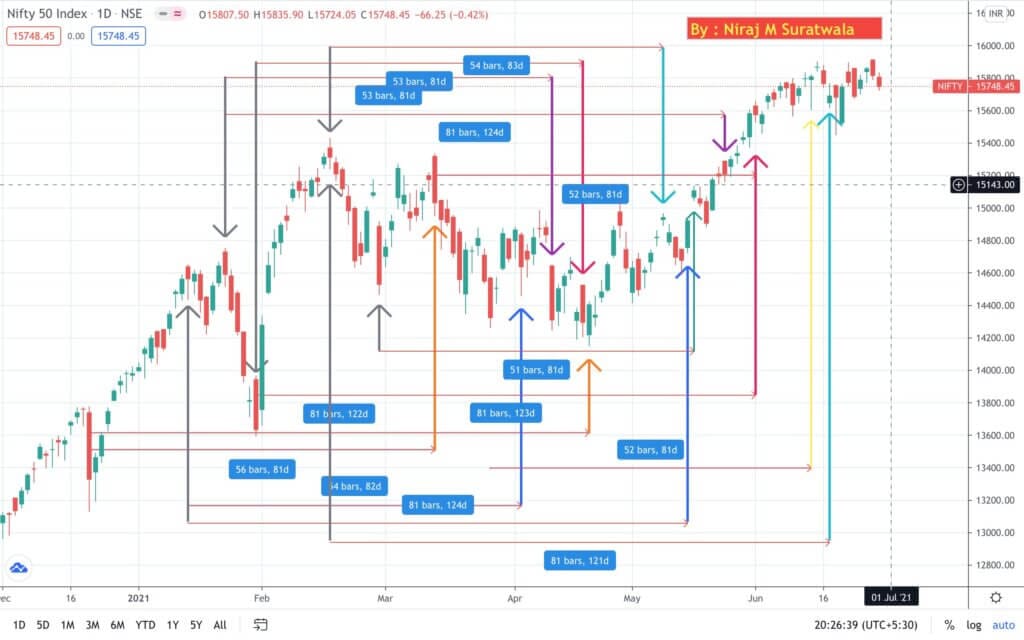
Essentially, by applying the aforementioned numbers starting from any peak or trough, you typically arrive at a future point where a trend change is observed.
Gann time cycle applied on a timeline using the geometry of The Circle:
William Delbert Gann believed that the timeline of any object is influenced by specific angular degrees, such as 45°, 90°, 135°, 180°, and 360°. At 360°, one full cycle is completed. He posited that the ongoing trend should change at every 4th, 7th, 8th, 10th, 11th, and 12th cycle—where the 4th cycle corresponds to 360° × 4, the 7th to 360° × 7, and so on.
Steps to apply these wonderful concepts are explained below:
- Find a top and apply all the mentioned degrees or circles from the exact top price,
- Mark the values of those circles on the price chart,
- You need to mark the opening price of the price candle that touches the mentioned circles first time. After this wait for 1 price candle to close above that opening price for a reversal.
Refer image below, in which I have applied this. All blue lines are mentioned circle levels. And, green lines are the opening price as explained above in 3rd step.

I will try to update further layers of the Gann time cycle here very soon. Due to time constrain, only this much information could be drafted and shared with you all.
Wish you all the very best!
Let me also share below some good articles’ link on WD Gann subjects, such as Gann law of vibration, Gann square of 9, etc.
Last but not least, Dowjones predictions.