This content is for educational purposes only and does not constitute investment advice. Price forecasts and ratings reflect the author’s personal research methodology, not guarantees of future performance. Please consult a SEBI-registered investment advisor before making investment decisions. The author and this website accept no liability for losses arising from reliance on this content.
Table Of Content
1. Reliance Industries Growth and Price Projection
2. Prediction of other stocks
3. Very common phenomenon you should avoid and must go through
Reliance Industries Ltd: Fundamental analysis (Growth projection and calculating price target)
Many influencing factors can impact the future price movement of Reliance Industries Ltd. Among all influencing factors, I have considered the most important ones on which price movement is highly dependent. Some steps are mentioned below that help predict the future price of any stock.
Step 1: Calculate current rating (based on the current status of those important influencing factors)
Step 2: Project future rating (this is possible if you can actually predict those influencing factors)
Step 3: Forecast price (Impact of the change between current rating and future rating on price is measurable, and with that, you can actually predict future price)
Outcome of the fundamental analysis process that I teach in my course:
Current Rating:
R1=7.08,
R2=4.21,
R3= True
Future Rating (Forecasted Rating):
R1=8.65,
R2=3.72,
R3= True
Forecasted Price (Price projection): Minimum 1695. Maximum 2734.
Generally, with a moderate approach, stocks’ actual future prices stay above the minimum forecasted price. So, very high chance that the price should remain above 1695 by 2028. And the maximum high of the stock till Dec’28 should be 2734.
Based on the WD Gann theory concept, Reliance Industries Ltd’s current active 5th cycle is 2283-2353.
Click the link below to refer to the Gann theory prediction on the same stock:
Reliance Industries Share Price Prediction
Some Predictions Made Following The Fundamental Analysis Process That I Teach In My Course:
👉Real Case Studies of fundamental analysis of stocks

First Common Mistake In The Fundamental Analysis Process
Investing in the company that reports the highest annual net profit: A company reporting the highest annual net profit among more than 5,000 listed and actively traded securities does not necessarily deliver the highest return on investment.
Group A: To examine this tendency, I will first identify the five companies with the highest annual net profits and analyse the corresponding change in their share prices.
Reliance Industries Ltd: 95,754 Crore INR
State Bank of India: 86,666 Crore INR
HDFC Bank: 79,219 Crore INR
ICICI Bank: 57,936 Crore INR
TCS Ltd: 1 Crore INR
Let us now see how much these companies’ share prices have changed over the last 5 years.
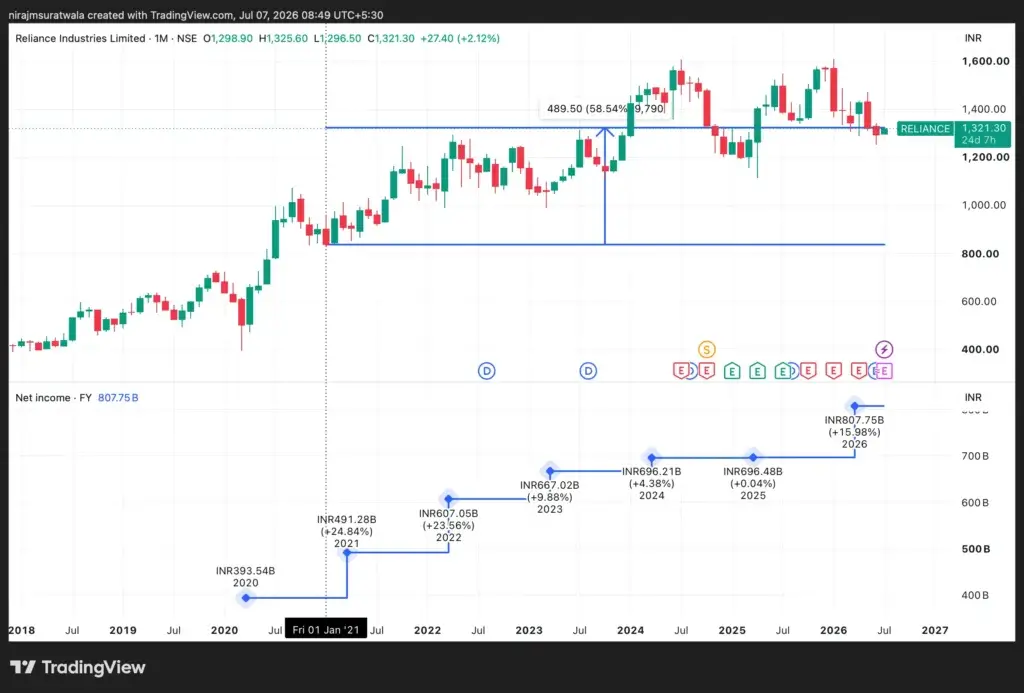
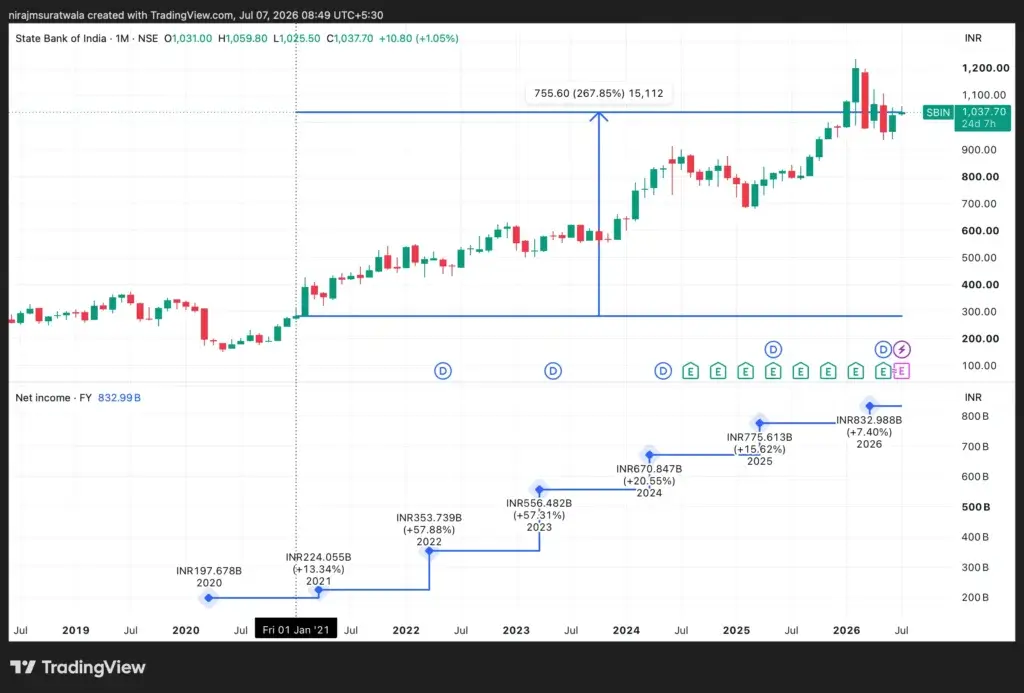
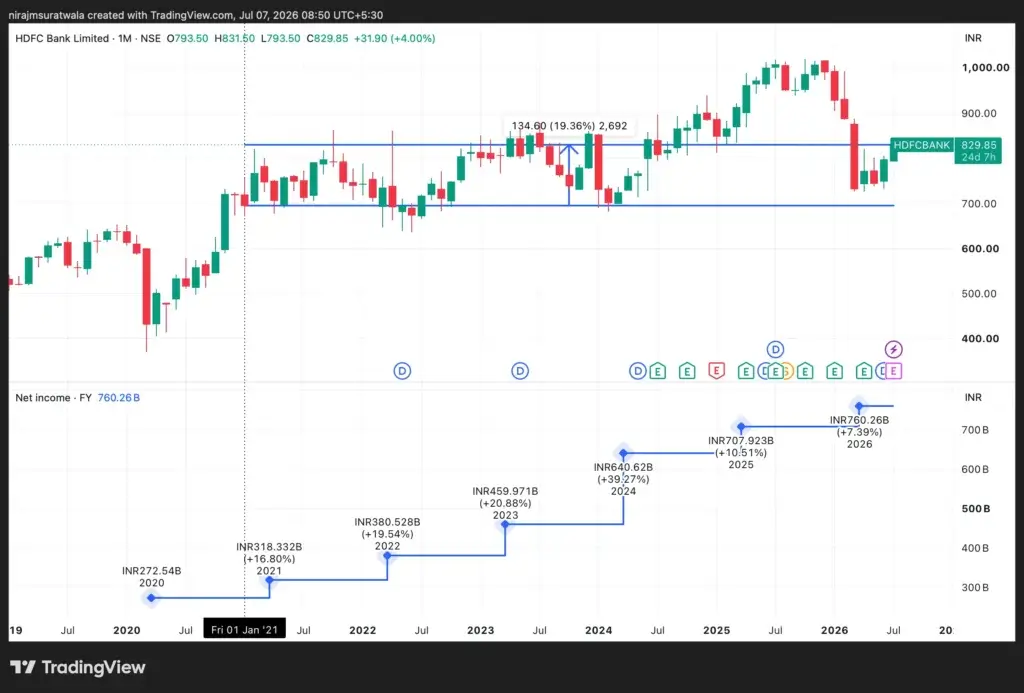
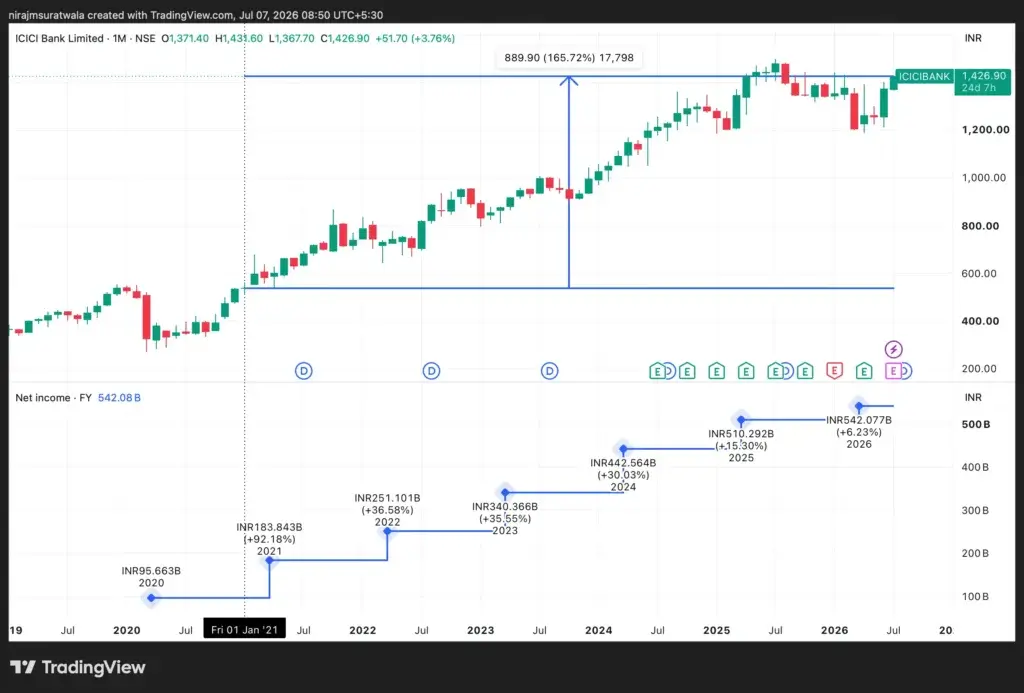
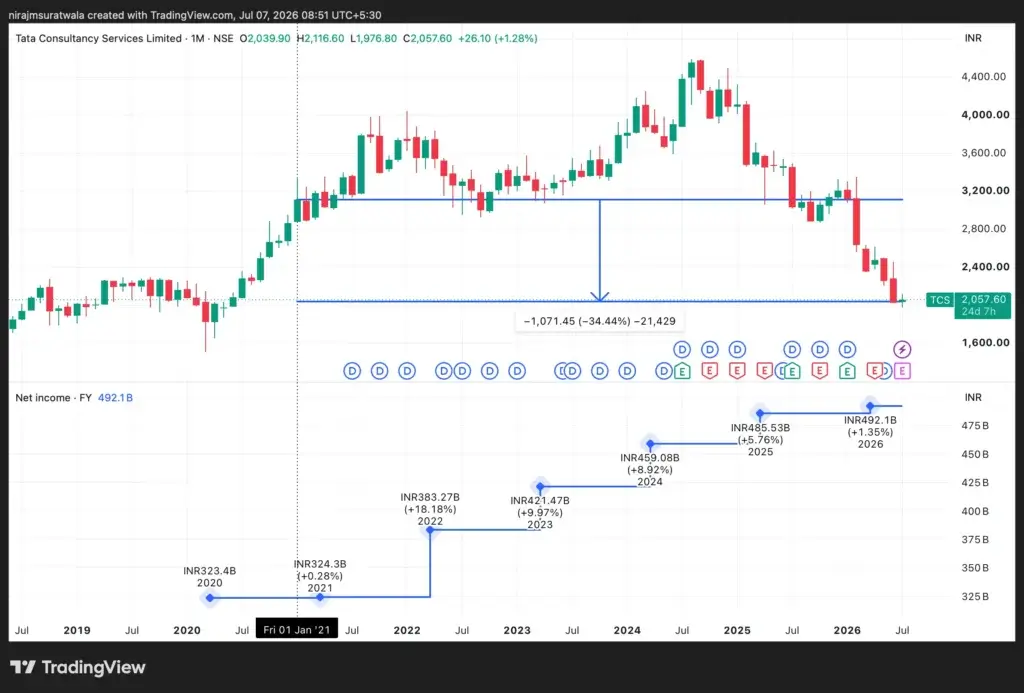
From the images above, it is clear that there has been no significant impact on their prices, even though these companies consistently ranked among those reporting the highest annual net profits.
Group B: Now let me share five companies that reported an annual net profit of only ₹ 100 crore, and let us examine the corresponding change in their share prices.
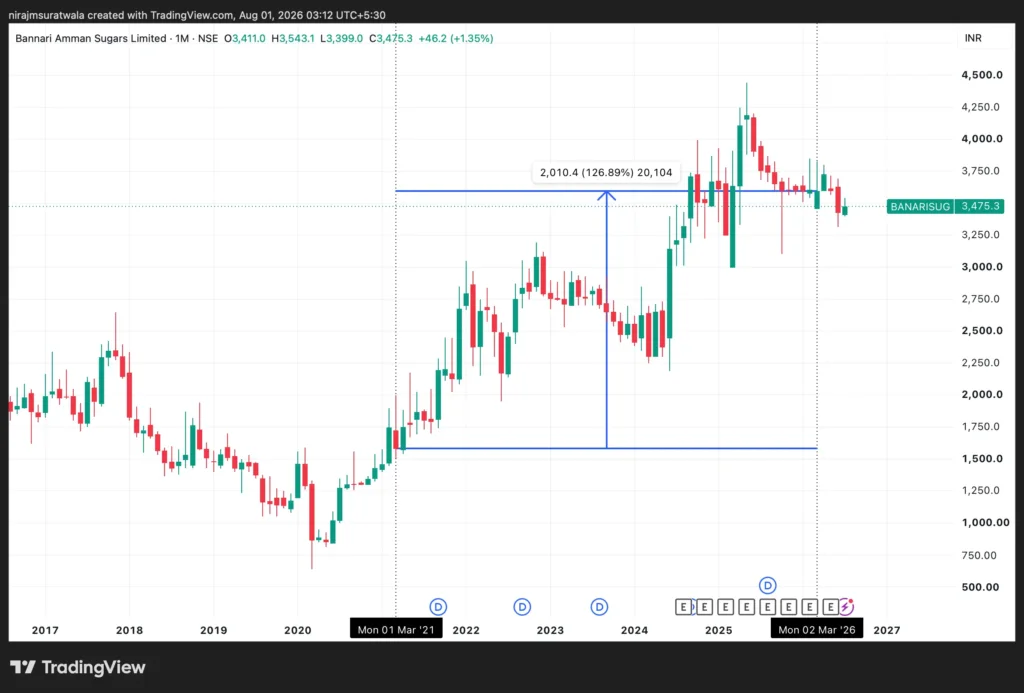
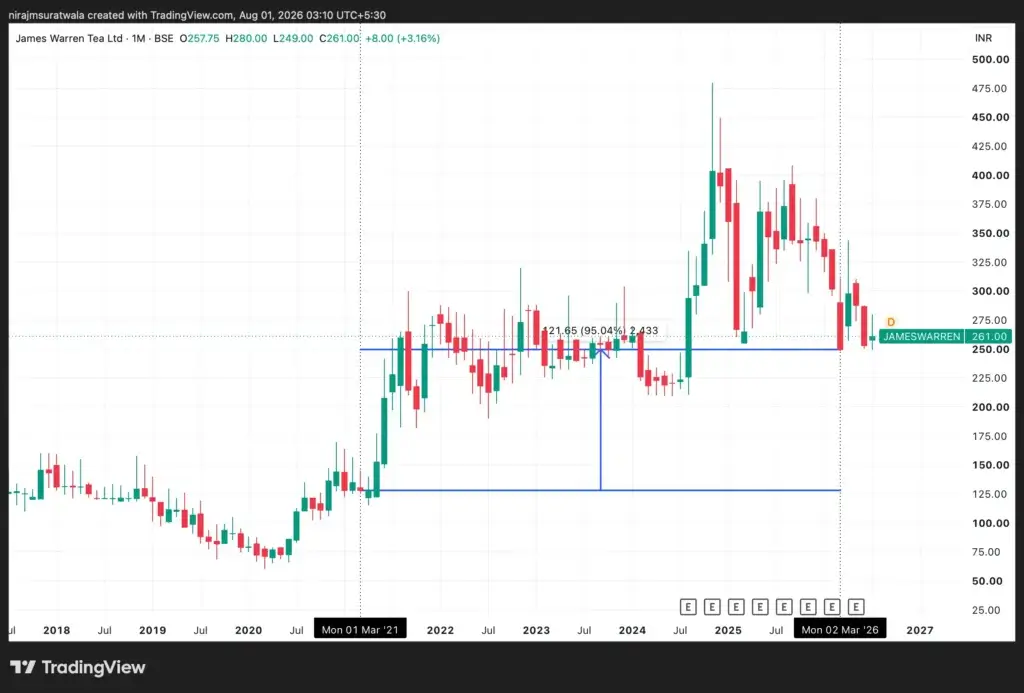
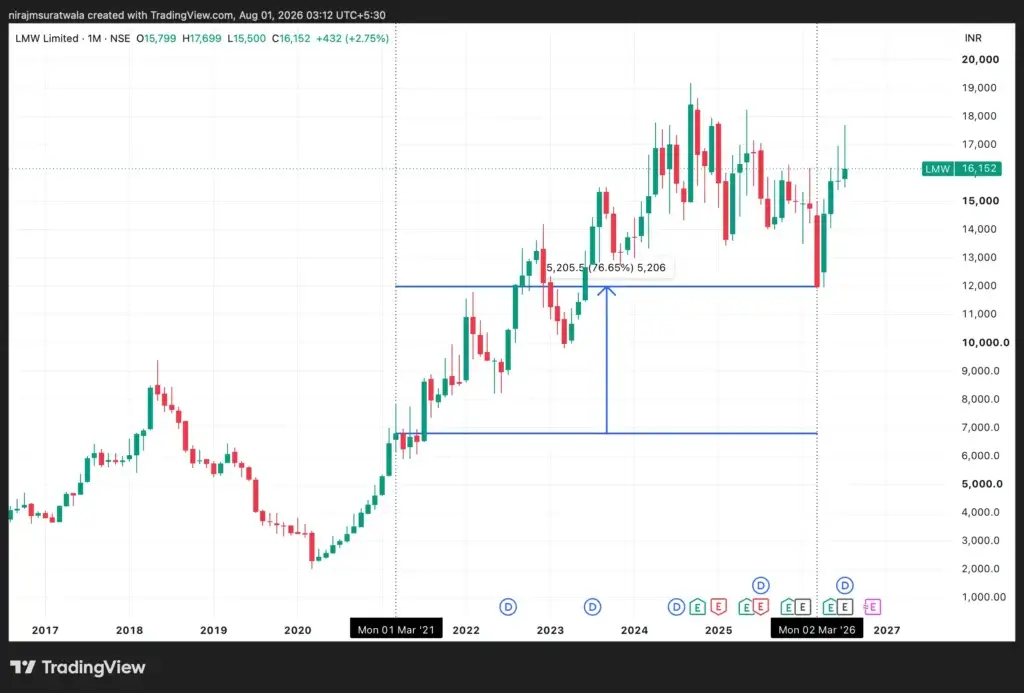
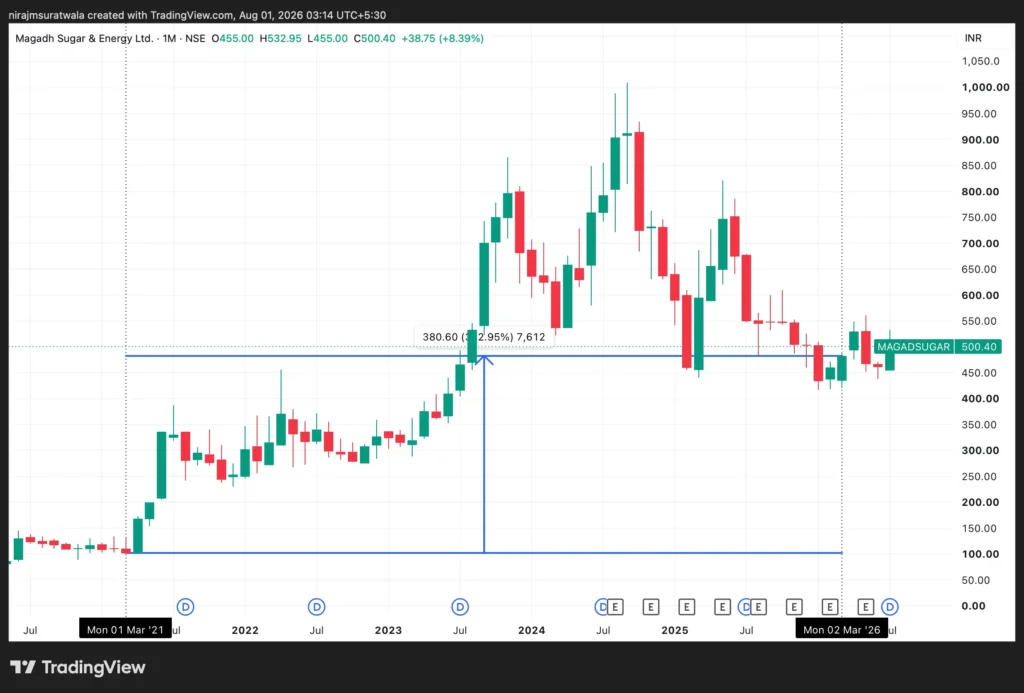
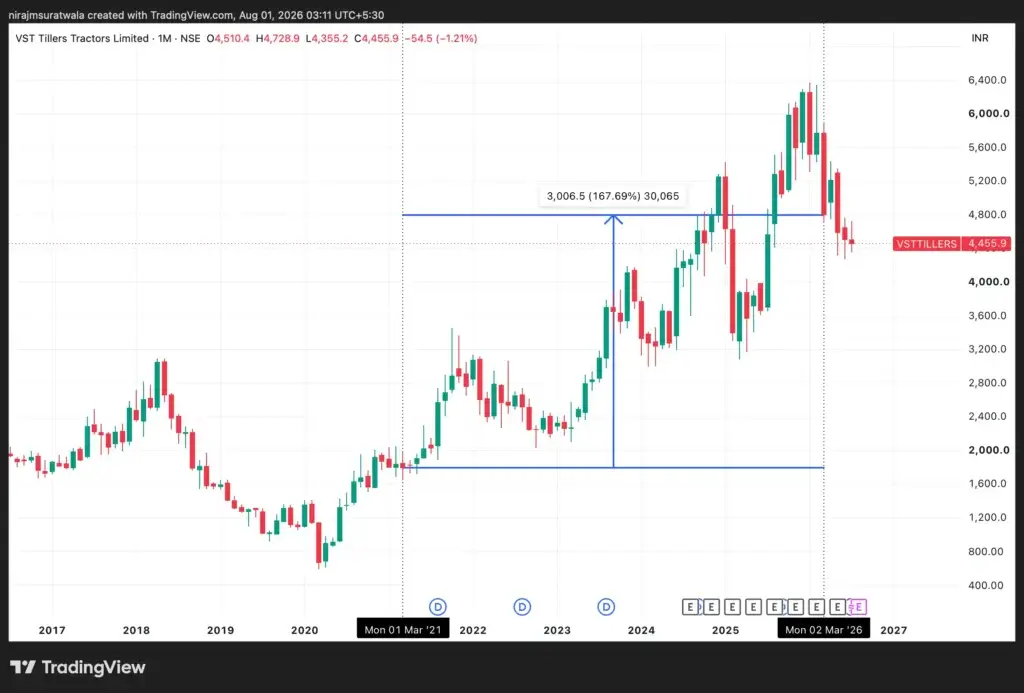
Let us know make a clear comparison between Group A and Gorup B to examine whether there is really a significant difference in the share prices of companies reporting the highest net profits.
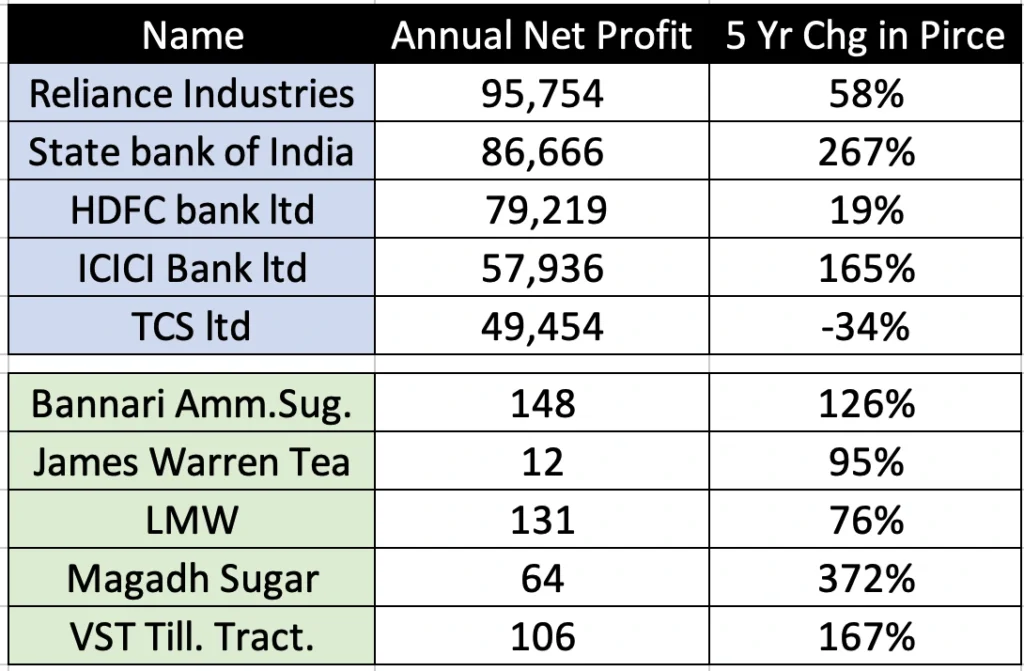
In the image above, companies marked in blue belong to Group A, while those marked in green belong to Group B. It is very clear that Group B companies, despite reporting quite small annual net profits, have delivered good returns to investors.
Read More related blogs (providing links below):

