Table Of Contents
- Price Earning Ratio Meaning
- What Is A Good PE Ratio
- Price-To-Earnings Ratio Formula
- Price-To-Earnings Case Studies
- Final Conclusion
When investing in stocks, your profit depends on how much the share price rises in the future. To identify the right stocks, you first need to study the key factors that influence their price movement. After analysing these important factors, you shortlist fundamentally strong companies that look promising.
Only at the final stage should you check the PE ratio. Ideally, it is safer to invest in companies whose PE ratio falls between 15 and 35.
Remember, the PE ratio is the last step, not the first. A stock must first pass through a solid fundamental analysis process. If you want to learn this complete step-by-step process of analysing stocks properly, you can check out my Fundamental Analysis Course.
Meaning Of Price-To-Earnings Ratio:
The P/E ratio simply tells us how much investors are ready to pay for every rupee of profit a company makes. In simple words, the P/E ratio shows whether a stock is expensive or cheap compared to the company’s actual income.
What is a good P/E ratio (Price earning ratio)?
There is no fixed rule for what counts as a high or low P/E ratio.
Generally, a high P/E ratio is seen as a sign that the stock is expensive, so many investors tend to avoid it. On the other had, a low P/E ratio is often viewed as having less potential-which is actually a common mistake made by investors.
Price-To-Earnings Ratio Formula: There is already plenty of information available online about the P/E ratio formula and the basic points. You can easily find and understand those from Google.
For example: Investopedia
I would prefer to spend time on something that is rarely discussed and not easily available elsewhere. I truly believe this insight is valuable, and you wouldn’t want to miss it – because it can help you avoid common mistakes that most investors make.
Price-To-Earnings Ratio: Interesting Case Studies
If I have to invest in a company by considering the P/E ratio, what should a normal investor cross-verify? Let’s look at a few important points:
A) Is a high P/E ratio always bad (or can it sometimes be good)?
B) Is a low P/E ratio always good for investment?
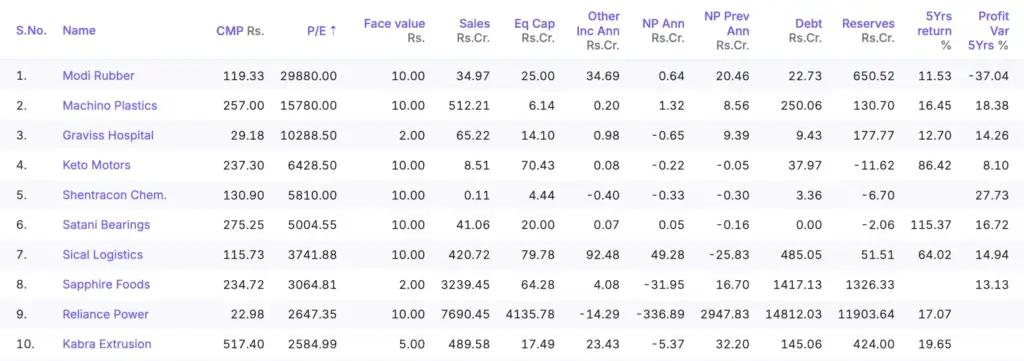
C) Check the P/E ratios of the top 10 companies with the highest 5-year returns.
A. Companies currently showing the highest P/E ratios:
Let us first take 10 companies that currently have the highest Price-to-Earnings (P/E) ratios. We will examine how much their share prices have changed and also study the relationship between the change in their P/E ratios and share prices over the last 5 years. This will give you a clear idea of whether there is any co-relationship between the two or not.
- Modi Rubber
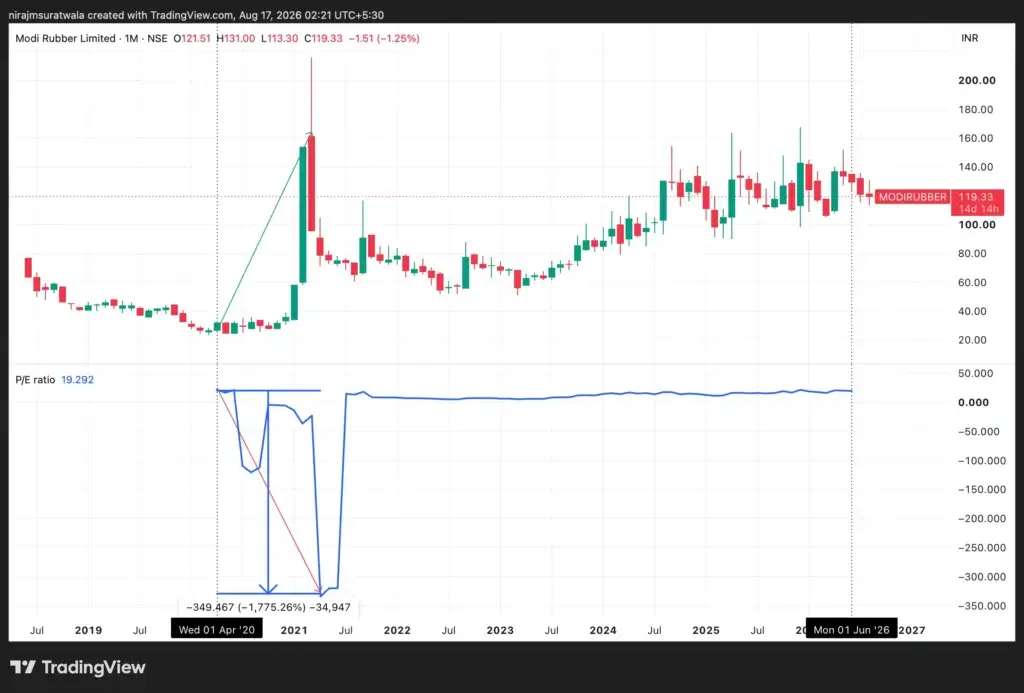
| Period | Price Behaviour | P/E Ratio Behaviour | Relationship |
|---|---|---|---|
| 2019 – Early 2020 | Price was declining | P/E was relatively stable then dropped sharply | Weak / Inverse at the end |
| April 2020 – Mid 2021 | Strong price rally (from 25 to 160+) | P/E went deeply negative (fell to around -350) | Strong Inverse |
| Mid 2021 – 2022 | Sharp price correction | P/E recovered sharply from deeply negative to positive | Inverse |
| 2022 – 2026 | Price mostly sideways to mildly up (range 80–160) | P/E stayed almost flat around 15–20 | Very Weak / Almost No correlation |
In this particular stock, the P/E ratio and share price did not move together most of the time. There was a clear inverse relationship only during the loss-making period. After the company returned to profits, the P/E ratio stopped reflecting price movements meaningfully.
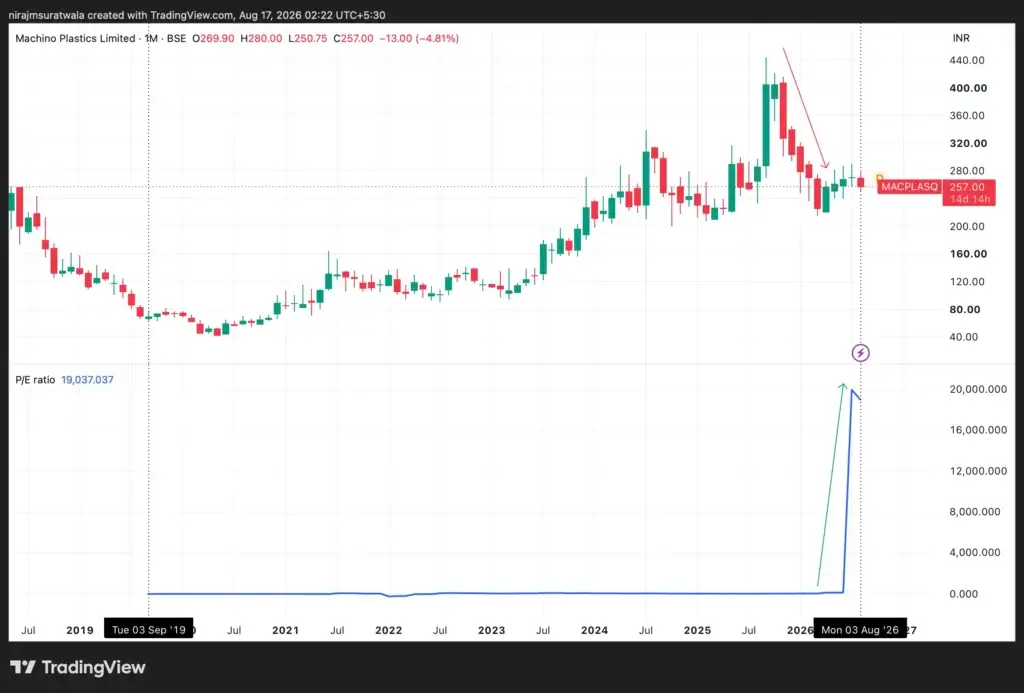
2. Machino Plastic Ltd:
| Period | Price Behaviour | P/E Ratio Behaviour | Relationship |
|---|---|---|---|
| 2019 – Early 2026 | Price moved in a wide range (from 50 to 440) with multiple ups and downs | P/E ratio stayed almost flat near zero for most of the time | No meaningful correlation |
| Mid to Late 2026 | Price corrected from the high of 440 towards 257 | P/E ratio suddenly exploded to an extremely high level (19,037) | Strong temporary spike (likely due to very low/near-zero earnings) |
There is almost no correlation between the share price and P/E ratio. The P/E stayed near zero for years despite big price movements, and the recent extreme spike is only due to very low earnings.
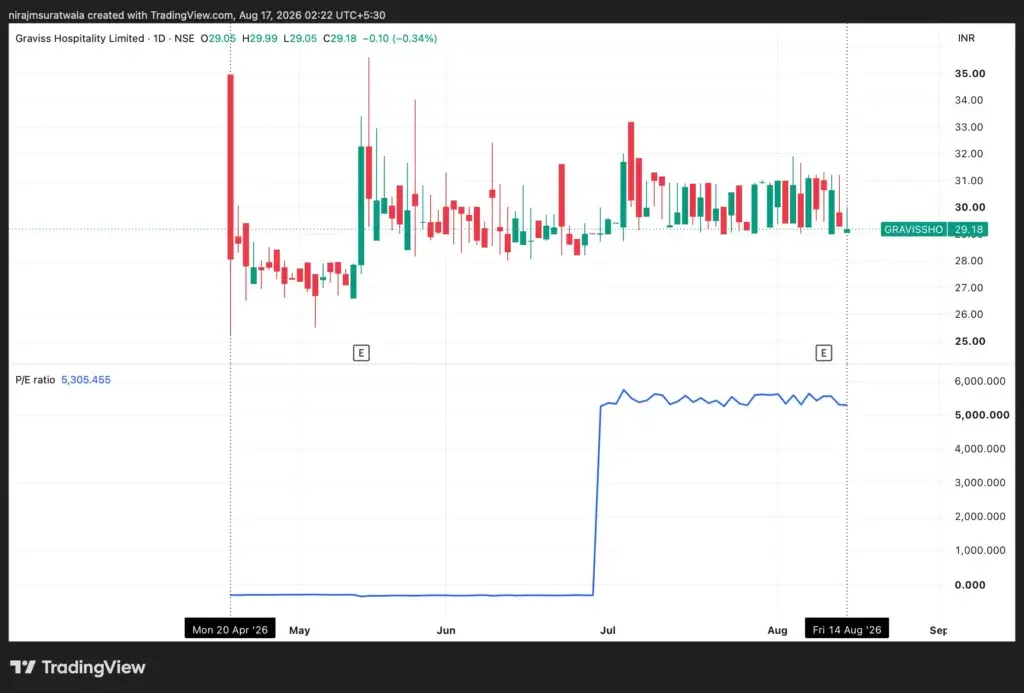
3. Graviss Hospital
| Period | Price Behaviour | P/E Ratio Behaviour | Relationship |
|---|---|---|---|
| Apr 2026 – Jun 2026 | Price moved in a narrow range (₹26–35) | P/E ratio stayed near zero | No correlation |
| Jul 2026 onwards | Price continued in the same narrow range | P/E ratio suddenly spiked above 5,000 | No correlation (distorted P/E due to very low earnings) |
Almost zero correlation between share price and P/E ratio. The extreme rise in P/E is not because of price increase, but due to a sharp drop in earnings.
4. Keto Motors
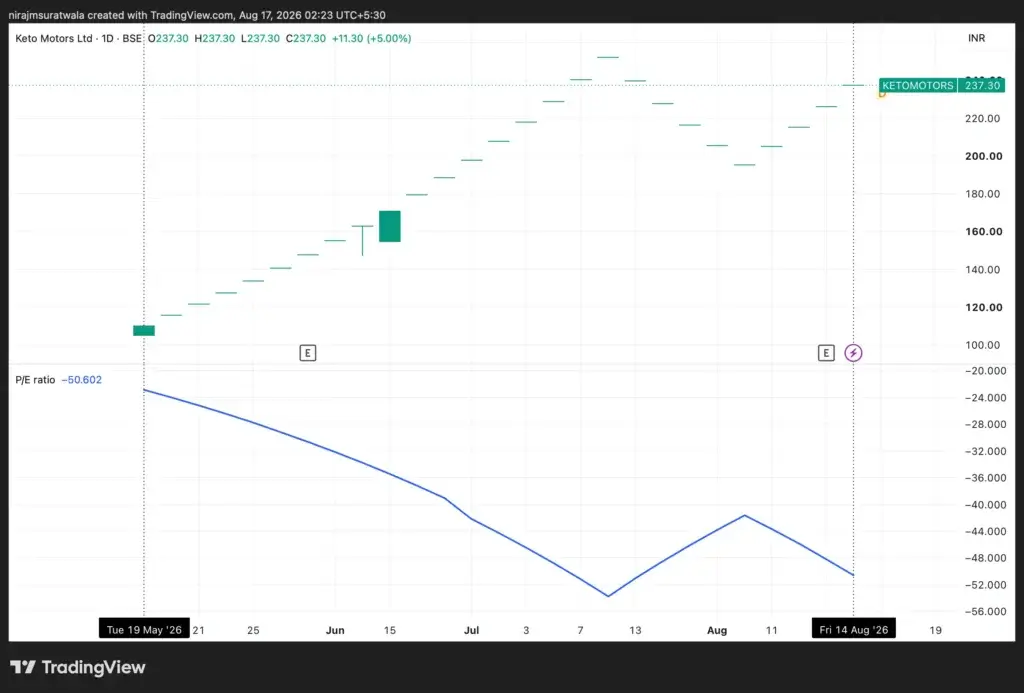
| Period | Price Behaviour | P/E Ratio Behaviour | Relationship |
|---|---|---|---|
| May 2026 – Aug 2026 | Strong uptrend (from 110 to 237) | P/E ratio remained deeply negative and mostly declined further | Inverse correlation |
Clear inverse relationship. While the share price rose sharply, the P/E ratio stayed negative and moved lower — indicating the company is making losses.
5. Shentracon Chemicals
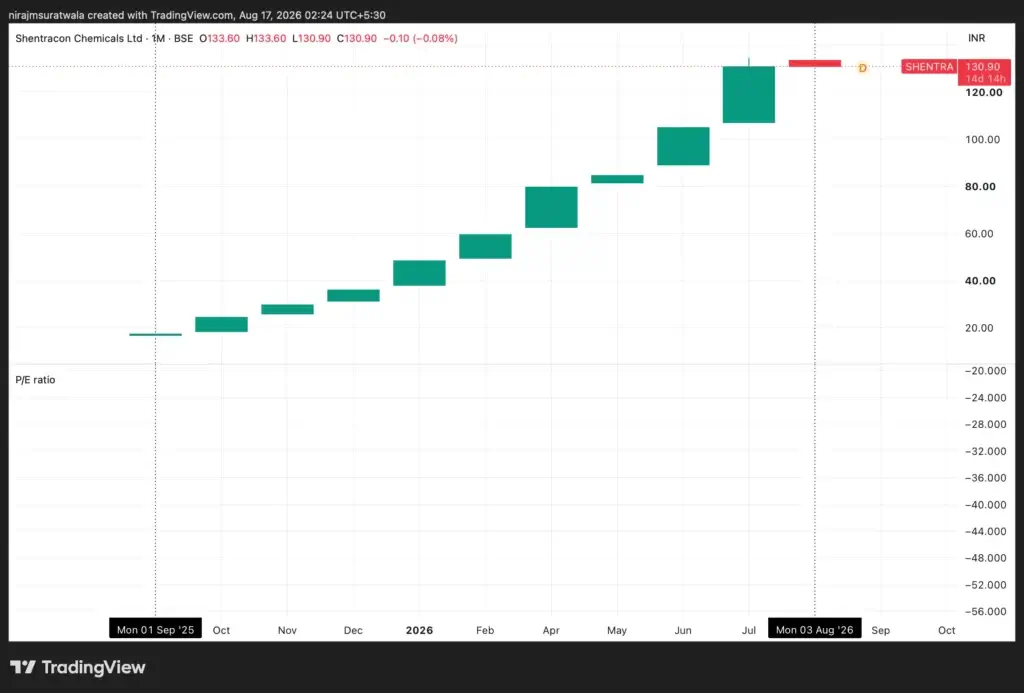
| Period | Price Behaviour | P/E Ratio Behaviour | Relationship |
|---|---|---|---|
| Sep 2025 – Aug 2026 | Strong and steady uptrend (from 18 to 131) | P/E ratio data is not available / not plotted | Cannot be determined |
Share price has risen sharply, but P/E ratio is not visible on the chart (likely due to negative or zero earnings). Therefore, no clear correlation can be established.
6. Satani Bearings:
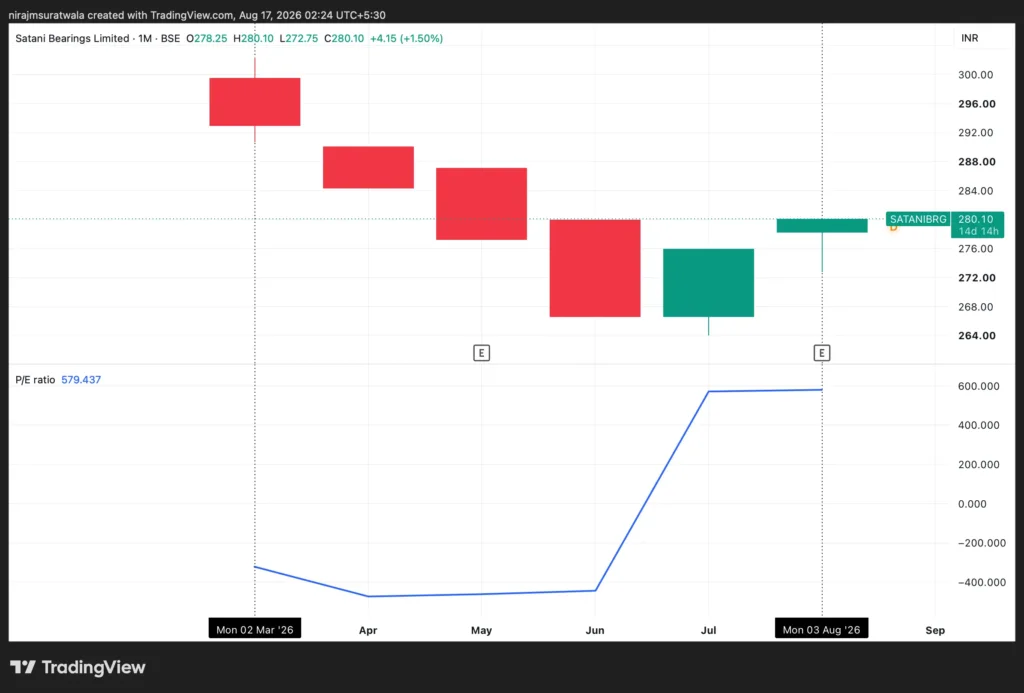
| Period | Price Behaviour | P/E Ratio Behaviour | Relationship |
|---|---|---|---|
| Mar 2026 – Jun 2026 | Gradual decline (from 300 to 268) | P/E remained negative and slightly declined | Weak / Mild Inverse |
| Jun 2026 – Aug 2026 | Price stabilized and recovered slightly | P/E ratio surged sharply from negative to +579 | No clear correlation |
No consistent relationship. Price moved in a limited range while P/E ratio swung dramatically from deeply negative to a very high positive level (due to change in earnings).
7. Sical Logistics ltd:
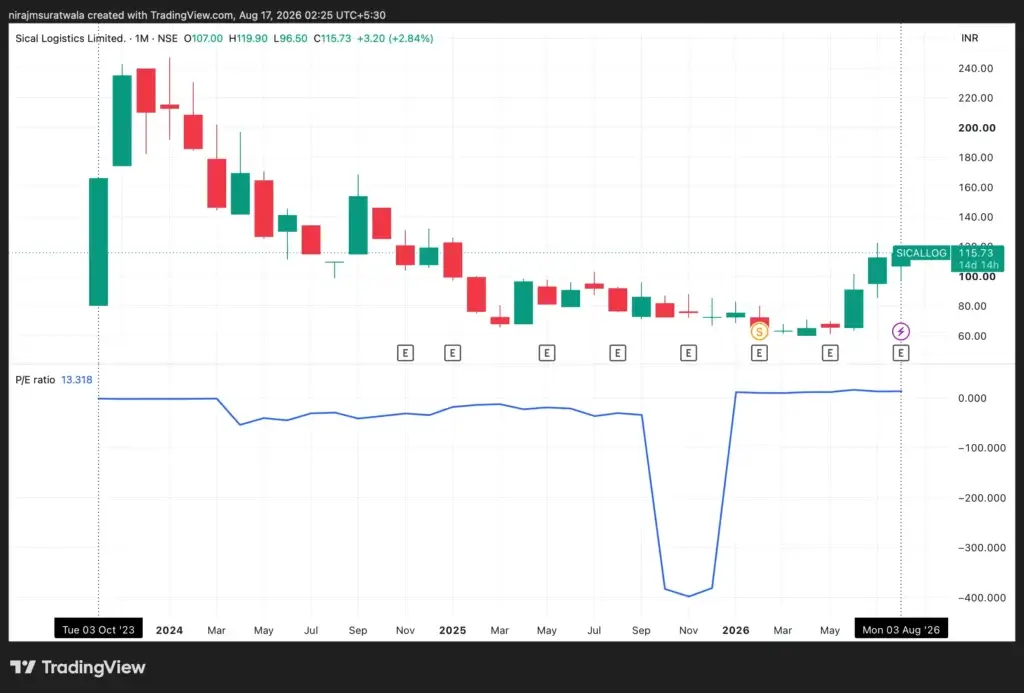
| Period | Price Behaviour | P/E Ratio Behaviour | Relationship |
|---|---|---|---|
| Oct 2023 – Sep 2025 | Steady downtrend (from 240 to 70) | P/E stayed mostly flat near zero / slightly negative | No meaningful correlation |
| Sep 2025 – Jan 2026 | Price continued sideways to mildly down | P/E crashed sharply to around -400 | Weak Inverse |
| Jan 2026 – Aug 2026 | Strong recovery (from 70 to 116) | P/E recovered sharply to positive (13.3) | Positive correlation |
Mixed relationship. For most of the period there was almost no correlation. Only in 2026, when earnings improved, both price and P/E ratio moved up together.
8. Sapphire Foods India Ltd:
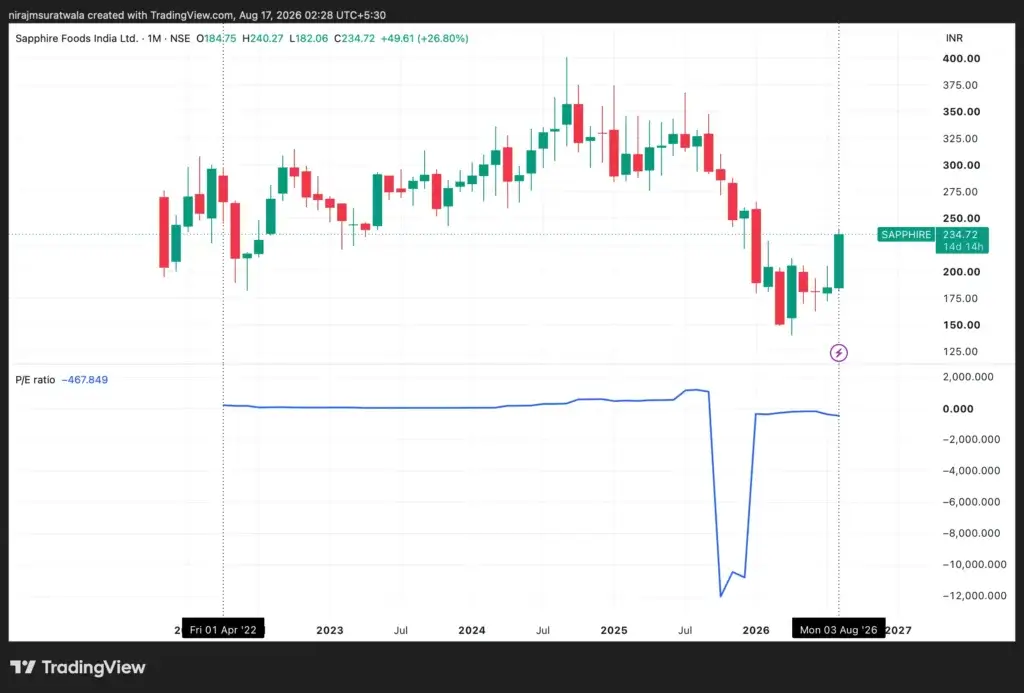
| Period | Price Behaviour | P/E Ratio Behaviour | Relationship |
|---|---|---|---|
| Apr 2022 – Mid 2025 | Overall uptrend with volatility (150 → 400) | P/E stayed relatively stable near zero / slightly positive | No meaningful correlation |
| Mid 2025 – Early 2026 | Sharp decline (from 375 to 150) | P/E crashed deeply negative (to around -12,000) | Positive correlation (both fell) |
| Early 2026 – Aug 2026 | Strong recovery (from 150 to 235) | P/E recovered sharply towards zero | Positive correlation |
Mostly weak correlation for a long period. Clear positive relationship appeared only during the sharp fall and recovery phase in 2025–2026, when both price and P/E moved in the same direction due to big changes in earnings.
9. Reliance Power Ltd:
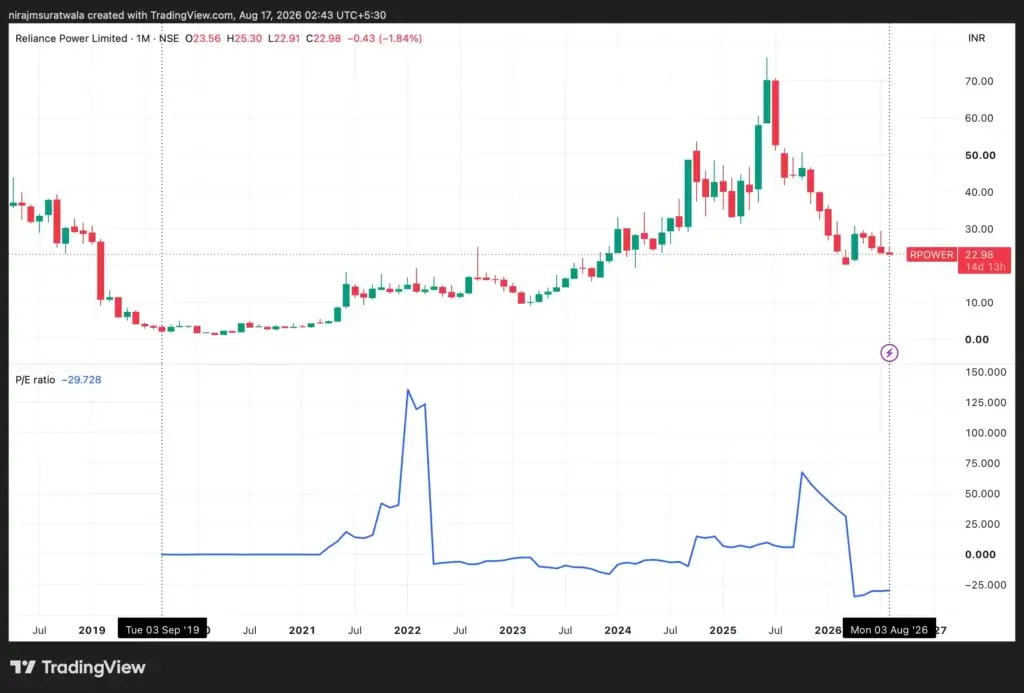
| Period | Price Behaviour | P/E Ratio Behaviour | Relationship |
|---|---|---|---|
| 2019 – Early 2021 | Sharp decline then sideways | P/E stayed near zero | No correlation |
| 2021 – Mid 2022 | Mild recovery | P/E spiked sharply upward (to 130) then crashed | Weak / Temporary |
| 2022 – Mid 2025 | Strong uptrend (from 10 to 75) | P/E stayed low and range-bound | No meaningful correlation |
| Mid 2025 – Aug 2026 | Sharp decline (from 75 to 23) | P/E rose then turned negative | Mild Inverse |
Overall weak correlation. Big price moves (both up and down) occurred while the P/E ratio stayed relatively low or moved independently, showing that price action was not consistently driven by P/E changes.
10. Kabra Extrusion Ltd
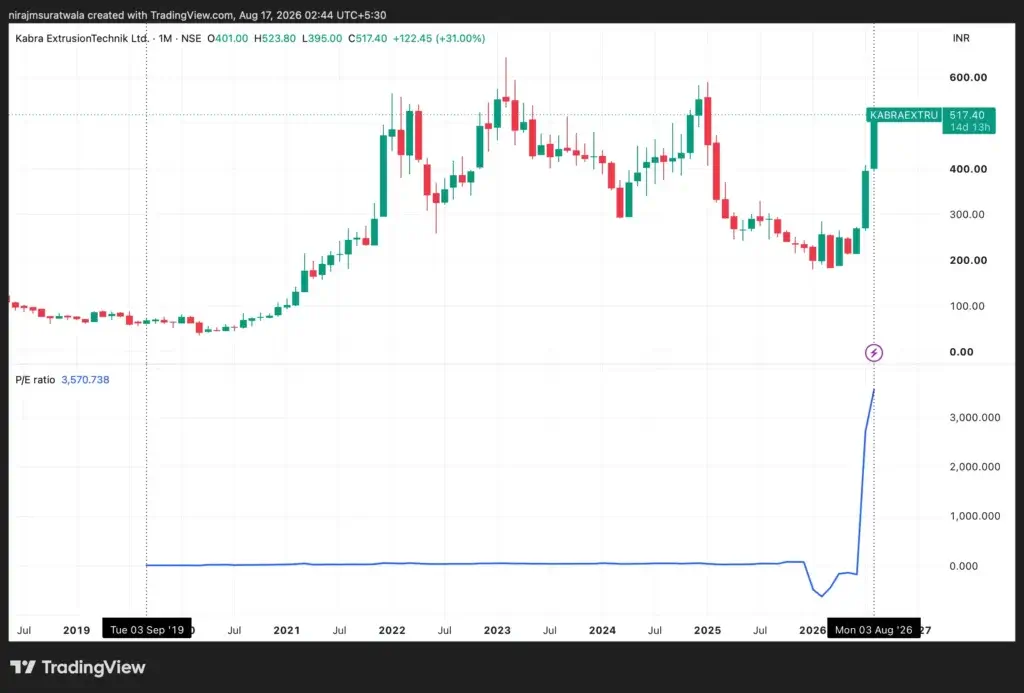
| Period | Price Behaviour | P/E Ratio Behaviour | Relationship |
|---|---|---|---|
| 2019 – Mid 2025 | Strong long-term uptrend with corrections | P/E ratio stayed almost flat near zero | No meaningful correlation |
| Mid 2025 – Early 2026 | Sharp decline | P/E turned slightly negative | Weak Inverse |
| Early 2026 – Aug 2026 | Strong recovery (from 200 to 517) | P/E exploded to an extremely high level (3,570) | No real correlation (distorted due to low earnings) |
Almost no consistent relationship for most of the period. The recent extreme spike in P/E is not because of price rise alone, but mainly due to a sharp drop in earnings.
(Based on all 10 companies analysed).
After studying the price and P/E ratio charts of 10 different companies, the overall conclusion is clear:
| Observation | Frequency | Insight |
|---|---|---|
| No meaningful / very weak correlation | Most cases | Price and P/E often moved independently |
| Inverse relationship | Few cases | Seen mainly when company was making losses |
| Positive correlation | Rare | Appeared only during short recovery phases |
| Extremely high or negative P/E | Common | Caused by very low or negative earnings, not by price movement |
Conclusion on high PE ratio companies:
There is no consistent or reliable relationship between share price and P/E ratio.
- A high P/E does not always mean the stock is expensive.
- A low or negative P/E does not always mean the stock is cheap or has no potential.
- In many cases, the P/E ratio becomes distorted due to temporary low profits or losses, while the share price moves for completely different reasons.
This is why relying only on the P/E ratio to judge whether a stock is cheap or expensive can lead to common mistakes.
B. Companies currently showing the lowest P/E ratios:
There are a total of approximately 8,450 companies actively listed and trading on the Indian stock market whose current market price is above ₹1.
Now, let us look at the 10 companies with the lowest P/E ratios.
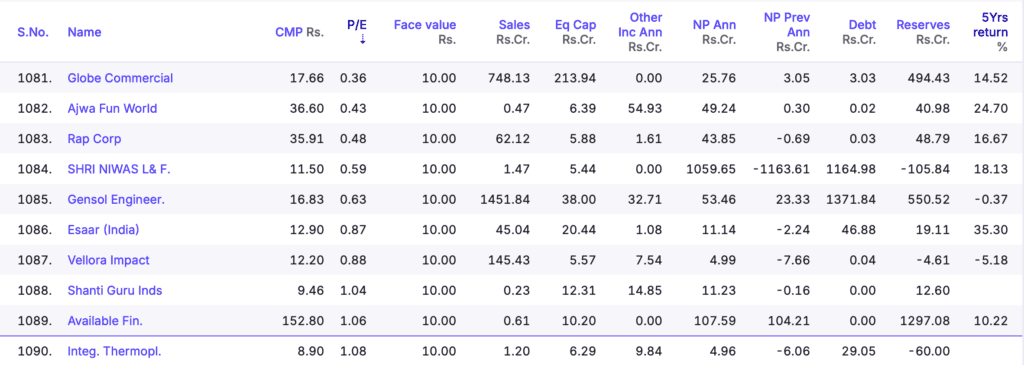
Now, just focus on “5-year share price returns”
| Company | Current P/E | 5-Year Share Price Return |
|---|---|---|
| Globe Commercial | 0.36 | +14.52% |
| Ajwa Fun World | 0.43 | +24.70% |
| Rap Corp | 0.48 | +16.67% |
| SHRI NIWAS L & F. | 0.59 | +18.13% |
| Gensol Engineer. | 0.63 | -0.37% |
| Esaar (India) | 0.87 | +35.30% |
| Vellora Impact | 0.88 | -5.18% |
| Available Fin. | 1.06 | +10.22% |
Now, let us look at the 5-year share price returns of the companies with the highest P/E ratios.
| Company | Current P/E | 5-Year Share Price Return |
|---|---|---|
| Modi Rubber | 29,880 | +11.53% |
| Machino Plastics | 15,780 | +16.45% |
| Graviss Hospital | 10,288 | +12.70% |
| Keto Motors | 6,428 | +86.42% |
| Satani Bearings | 5,004 | +115.37% |
| Sical Logistics | 3,741 | +64.02% |
| Reliance Power | 2,647 | +17.07% |
| Kabra Extrusion | 2,584 | +19.65% |
The 5-year share price returns of most of these 20 companies (both the lowest and highest P/E) are quite similar.
The only clear exceptions are Keto Motors, Satani Bearings, and Sical Logistics, which delivered significantly higher returns compared to the rest.
As an investor, whether I select companies with the highest P/E ratios or the lowest P/E ratios, it doesn’t seem to make any significant difference to my investment returns.
C. Out of 8,450 listed companies, let’s check the P/E ratios of the top 10 companies with the highest 5-year returns
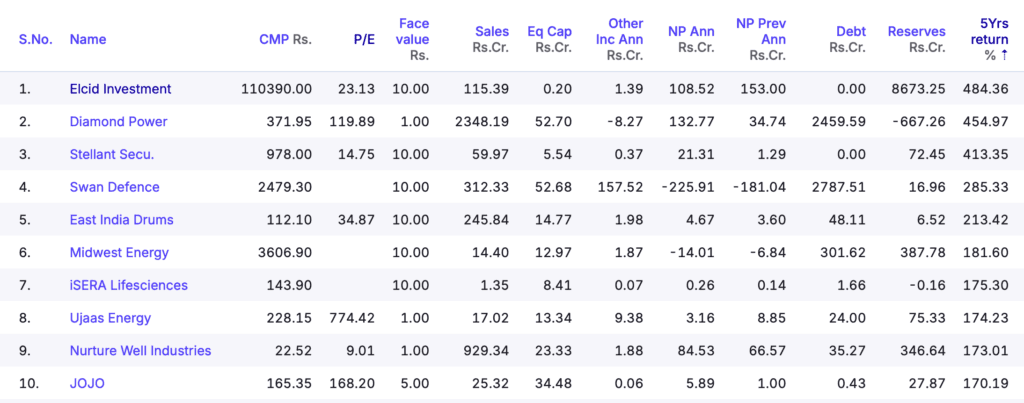
Looking at the top 10 companies with the highest 5-year share price returns, there is no clear pattern in their P/E ratios. Some have low P/E while others have high P/E — it’s a mixed bag.
This shows that we cannot reliably decide a company’s future returns based on P/E ratio alone.
D. Let’s examine the P/E ratios of the 10 companies with the lowest 5-year returns.
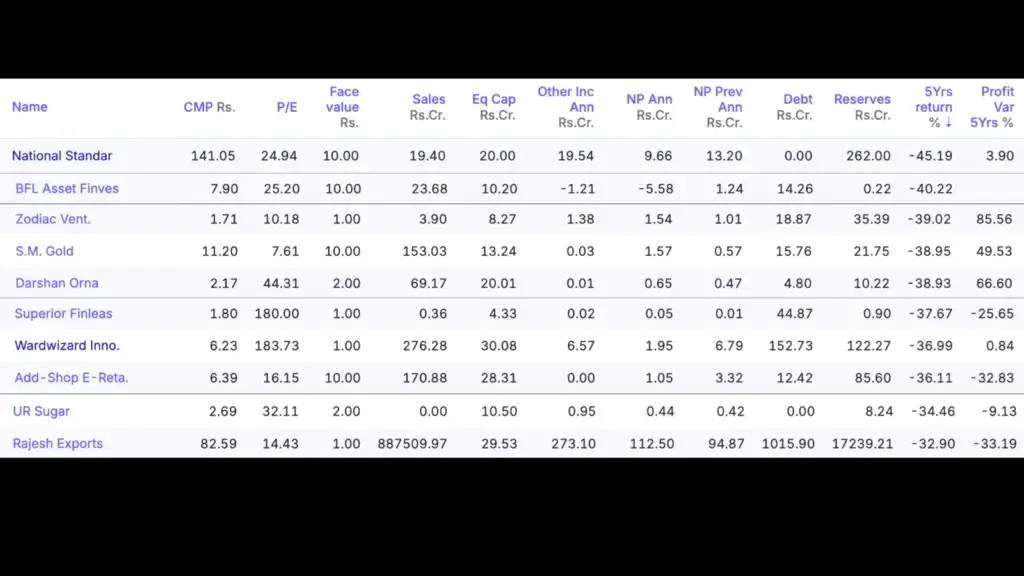
Key Takeaway:
Even among the worst-performing stocks over 5 years, the P/E ratios are mixed:
- Some have low P/E (Zodiac, S.M. Gold)
- Some have moderate P/E
- Some have very high P/E (Superior Finleas, Wardwizard)
Conclusion remains the same: There is no clear relationship between P/E ratio and share price performance — whether the returns are high or low.
5. Final Conclusion:
At the end of the day, the PE ratio is just one number — and not even the most important one. As we saw across those ten high-PE and ten low-PE companies, there’s simply no reliable connection between a stock’s PE and how it actually performs. High PE doesn’t always mean expensive, and low PE doesn’t always mean a bargain. The real mistake is using PE as your first filter. Do your proper fundamental analysis first, shortlist strong businesses, and only then check if the PE falls in a reasonable range — ideally between 15 and 35. Treat PE as the last step, not the deciding factor. Because in the end, you’re investing in a business, not in a ratio.
Read More Such Insightful Blogs (providing links below):
Fundamental Analysis Of Reliance Industries Ltd For 2026 to 2029 Period

