Gann Cycles And Charts For Dow Jones Analysis and Prediction
In trading or investing, timing is vital. I have been practising WD Gann theory for making successful predictions on various tradable and investable instruments for 20 years. Here, in this article, you will get a glimpse of how useful using the Gann law of vibration and the Natural Time Cycle in timing Dow Jones and other instruments.
Sharing all Dow Jones predictions and analysis below (from older to recent order).
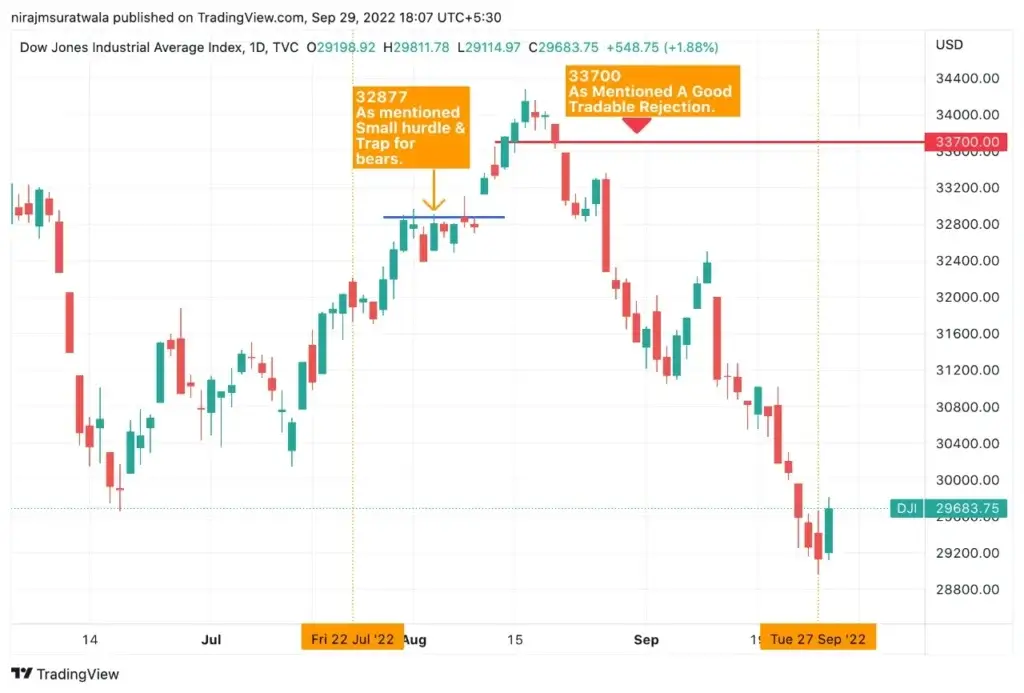
1. 19/9/21 predicted reversal from Gann levels. (refer attached image)
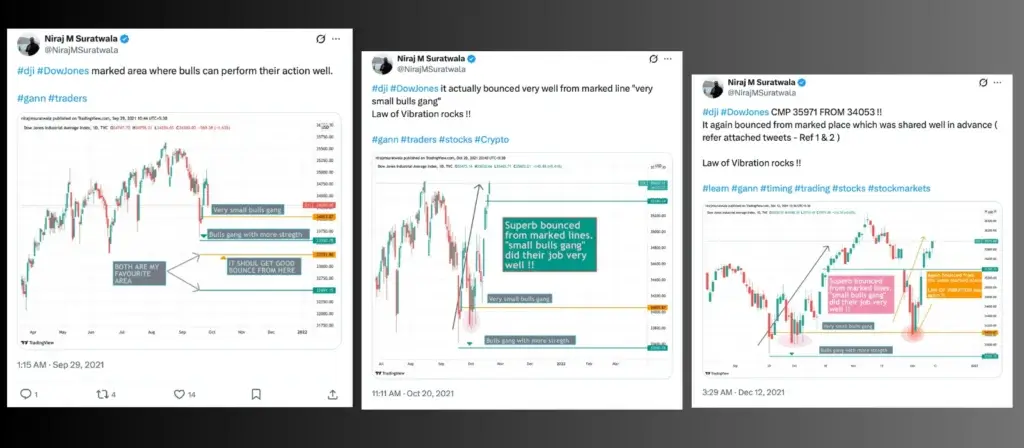

As a result of the prediction, Dowjones first move towards 33700 from 32036 and then faced solid rejection of more than 1000+ points!
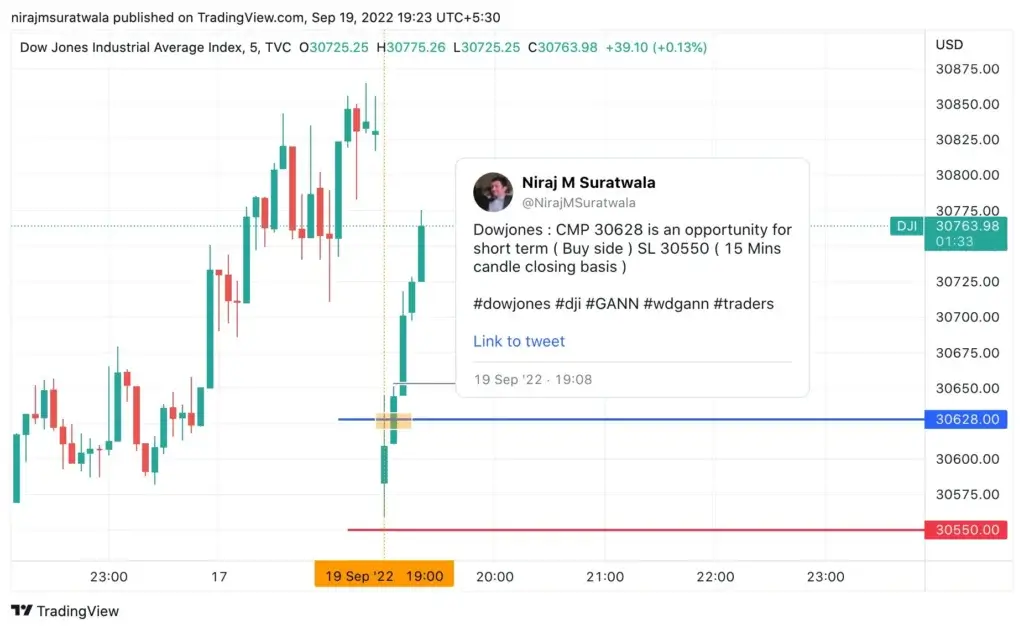
3. A tradable opportunity was identified in Dow Jones in a smaller time frame, as mentioned in the image attached below.
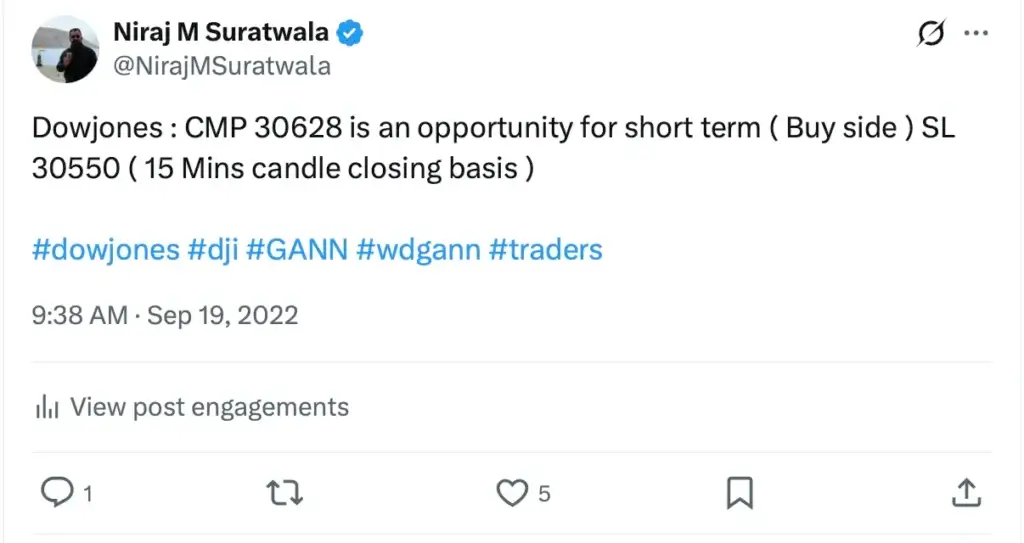
As a result, Dowjones successfully bounced from the given Gann level! (refer image attached below).
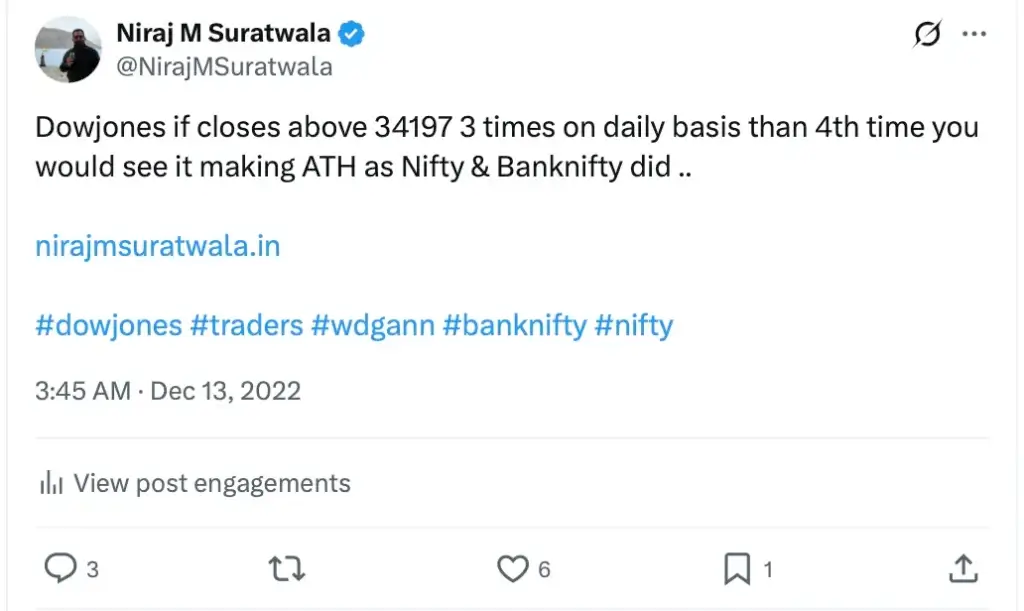
4. On 13/12/22, Dowjones price was 33900 and predicted it to make a new all-time high (ATH).
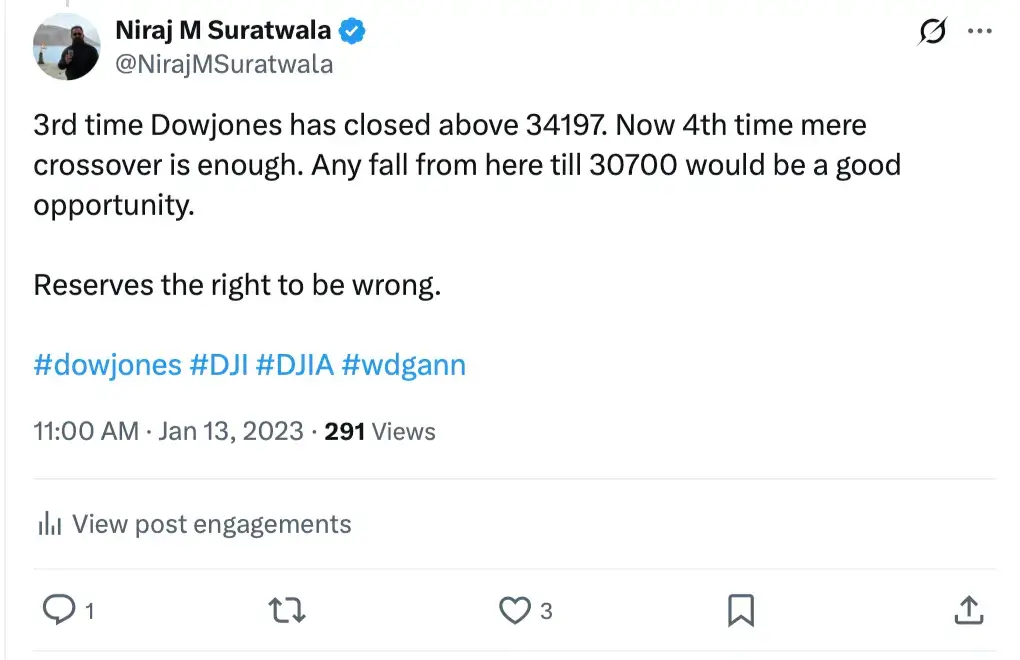
On 13/1/23, again hinted about the possibility of Dowjones move towards the all-time high (ATH).
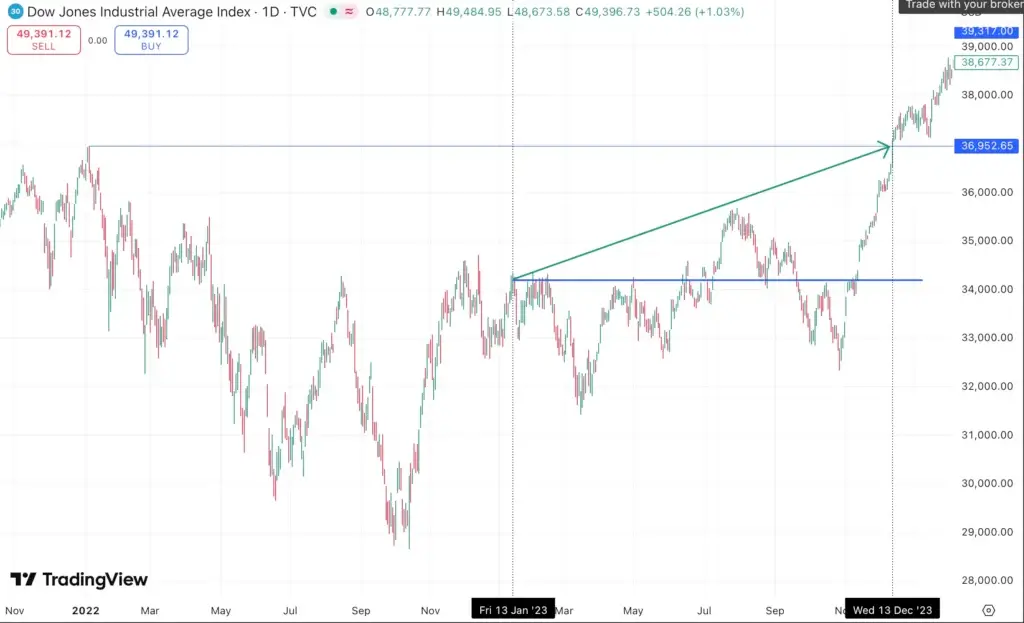
From the attached image below, we can see that Dowjones made a good base and successfully headed towards the direction to make a new all-time high. Between 13/1/23 to 13/12/23, the whole timeline of many social media platforms was flooded with anticipation of a crash-like situation. But thanks to the W.D. Gann concepts, especially the Gann Octave Theory, which helped to realise we are actually about to move towards new heights.
Impact post 13/1/23:
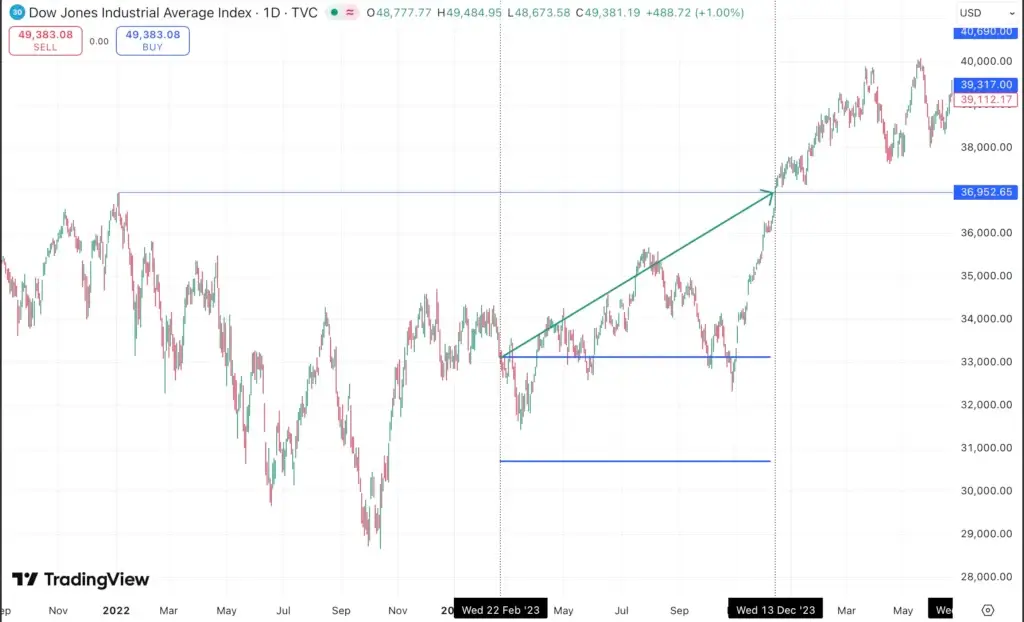
Impact post 22/2/23:
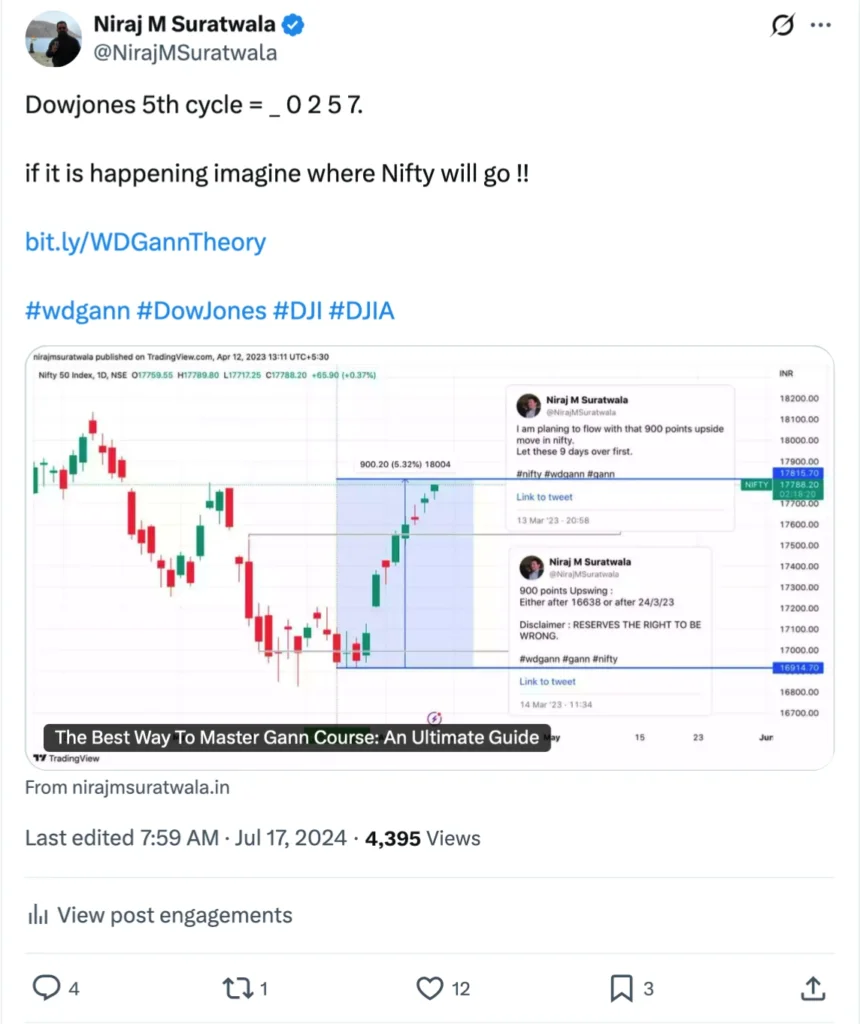
5a. Predicted 50527 Gann level in Dow Jones when it was at 41,198.
Also, the world was expecting Russia-Ukrain war to intensify and cause a major crash in the Stock market. But very few knew that before the 5th cycle (50,527) completion, we are not facing any crash-like situation. I feel totally blessed to be able to share about 50,527 Gann levels much earlier than even when it is shared by me on my X platform! (Refer image attached below).
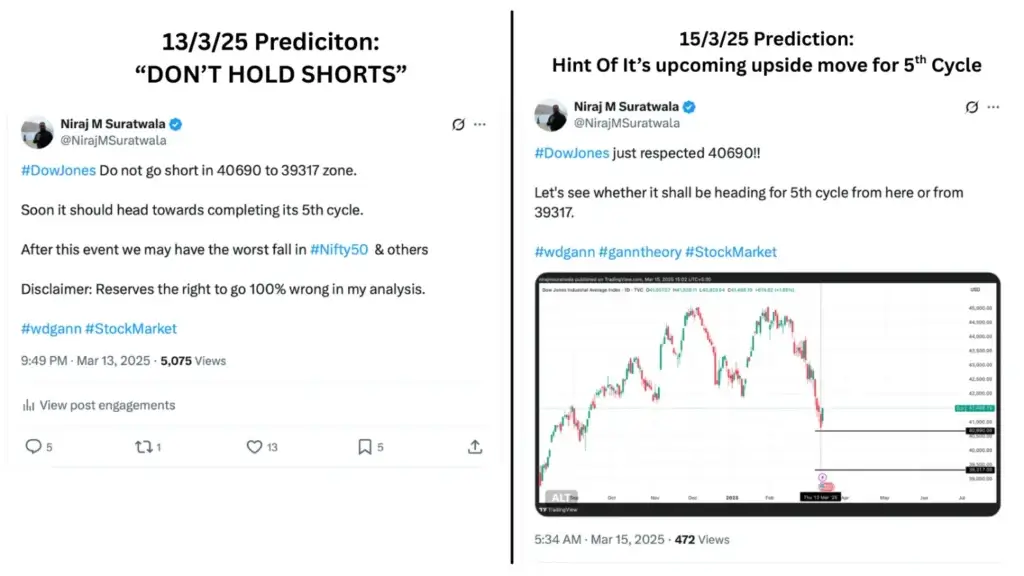
5b. After sharing the above prediction of 50,257, on 13/3/25, I posted on my X platform to avoid holding any short positions.
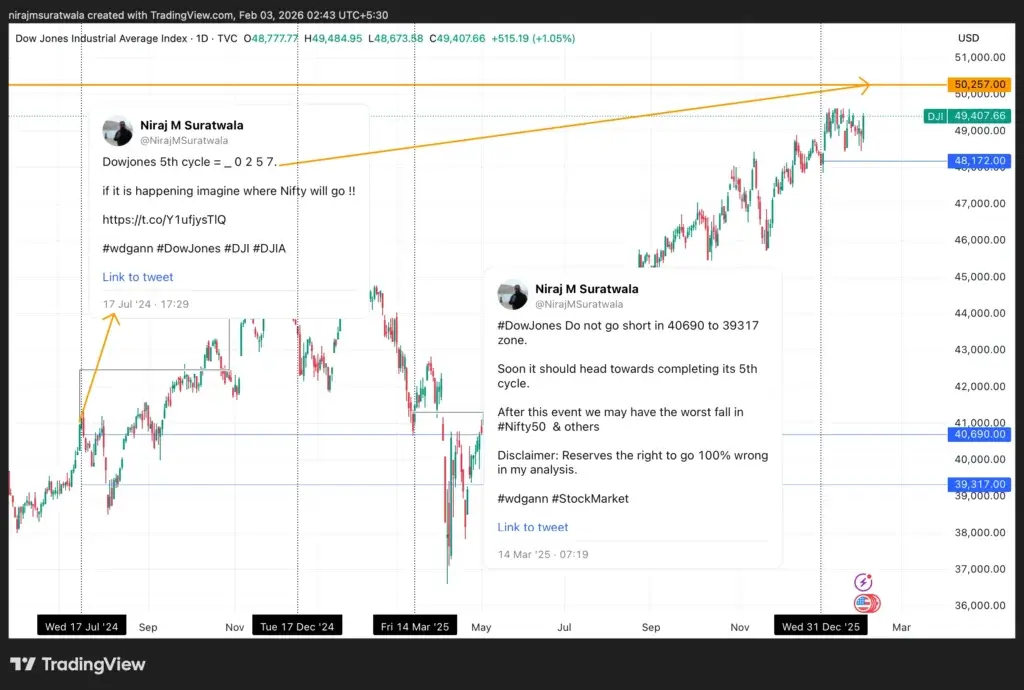
Summarising the results of all predictions in 1 image as attached below,
5a) 17/7/24 predicted and shared 50,257 level: We can see how Dowjones survived and headed towards that level.
5b) 13/3/25 “Do not go short in 40690 to 39317 zone”: We can see how Dowjones respected those Gann levels and stopped falling further. Furthermore, it started its move finally towards 50,527 (5th cycle)!
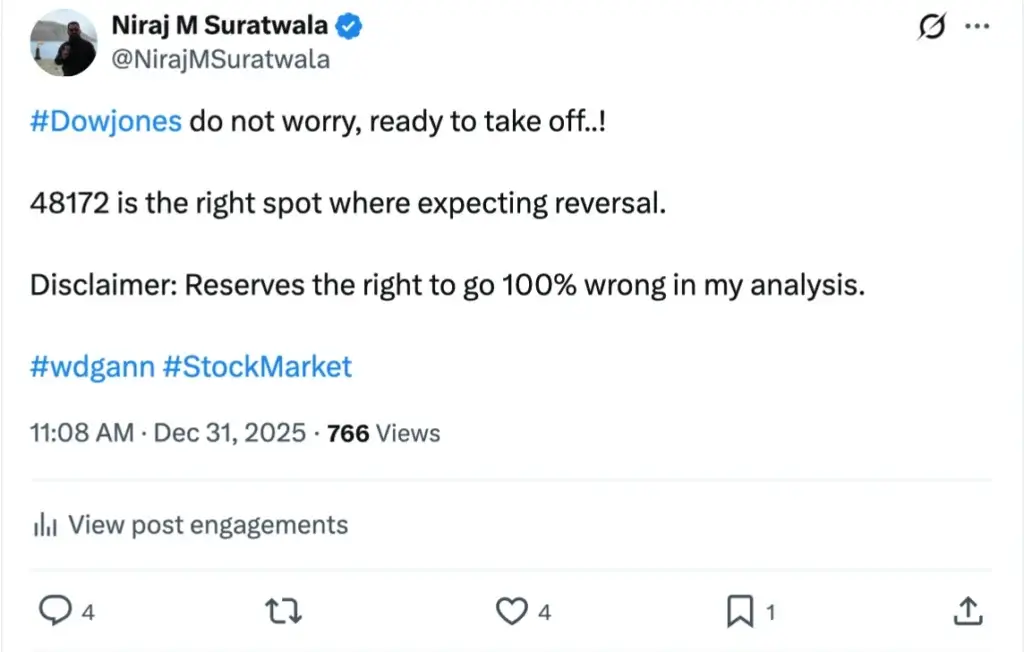
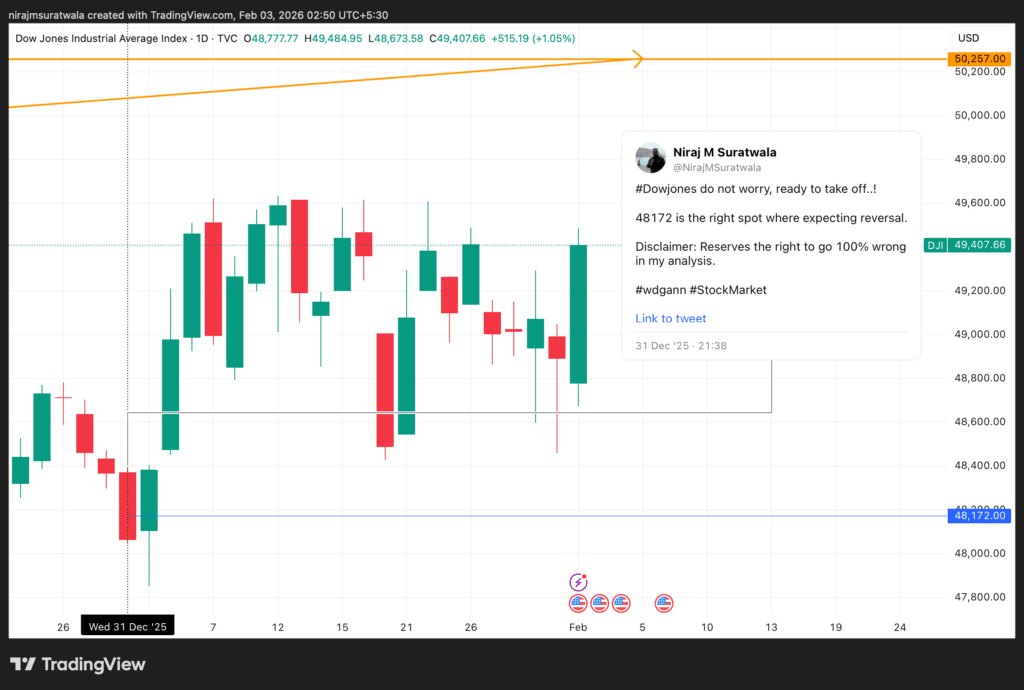
Yes, right after 31/12/25 and 48172 Gann level, Dowjones bounced and reversed successfully. (refer imaged attached below)
Disclaimer: Dow Jones Price Predictions and Trading Risks
The Dow Jones price predictions and market analyses shared, based on WD Gann Theory or other methodologies, are for informational and educational purposes only. They do not constitute financial advice, investment recommendations, or guarantees of future performance. Past performance is not indicative of future results, and investing in Dow Jones involves significant risks, including the potential loss of capital. Traders and investors are solely responsible for their decisions and should conduct thorough research, consult with qualified financial advisors, and carefully assess their risk tolerance and financial situation before making any investment. The author and any associated entities are not liable for any losses or damages arising from the use of this information. Always maintain a disciplined approach, adhering to proper risk-reward ratios and avoiding overleveraged positions.
Must-Read Articles to Deepen Your Understanding of W.D. Gann Theory:
Silver Price Predictions For Next 5 Years Using W.D. Gann Theory