Greetings, fellow investors and traders! I’m Niraj M Suratwala, and for over two decades, I’ve immersed myself in in-depth stock market analysis, delivering a track record of spot-on forecasts. Along the way, I’ve mentored upwards of 1,000 aspiring and established market enthusiasts. In this piece, I’m thrilled to offer valuable guidance that can empower everyone—from newcomers to veterans—in navigating the markets more effectively.
For those aspiring to thrive in the stock market, whether as investors or traders, mastering a few essential skills is key to achieving long-term success. Here’s what you need to focus on:
- Develop a consistent reading habit to stay informed.
- Avoid limiting yourself to historical events and past data alone.
- Cultivate the ability to anticipate future trends and possibilities.
While the first two elements can often be addressed through straightforward advice and resources, the third requires deeper insight and practice.
Achieving that third skill opens up several pathways for you to explore. For instance, you could delve into the WD Gann Theory, incorporate astrological insights, or adopt a straightforward method of interpreting data, much like the one I personally use.
I’d like to present a compelling case study that demonstrates a straightforward analysis of Yes Bank, blending the principles of the Gann time cycle with in-depth fundamental research on both Yes Bank and Bhel Ltd.
For more details, refer to this dedicated page 👉 Best Example
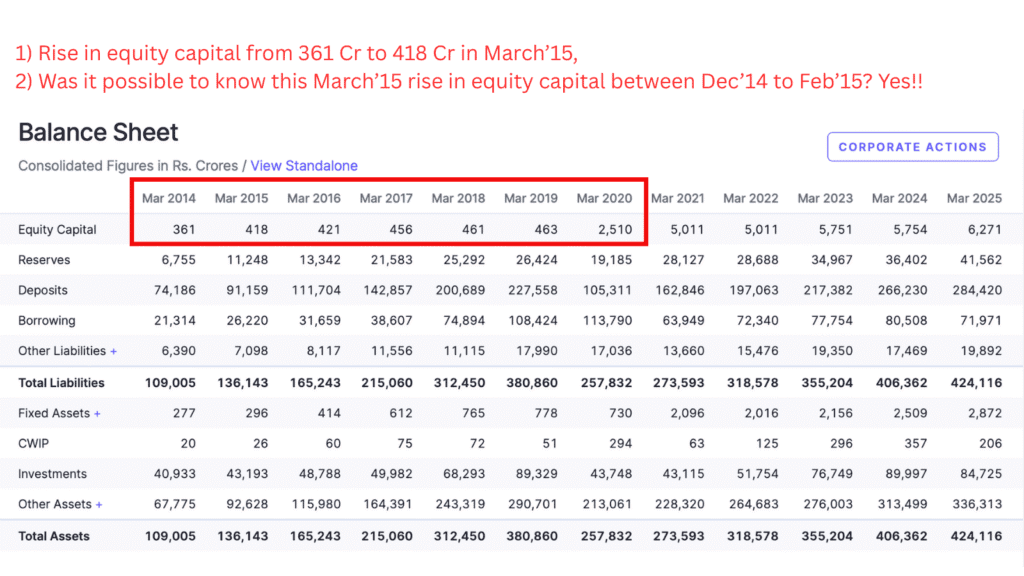
Analysing Yes Bank’s Performance: For this evaluation of Yes Bank, I’ve applied a basic yet effective metric to detect potential concerns. This entails verifying if the equity capital stays steady or grows each year. As shown in the chart below, it experienced an uptick beginning in March 2015.
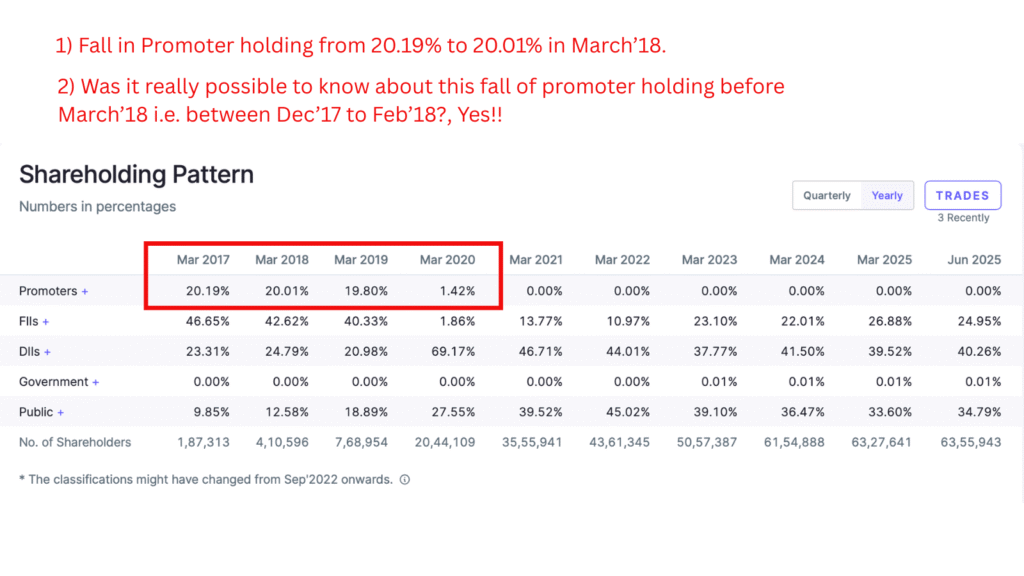
Another key and essential warning indicator to watch for is the simultaneous increase in equity capital paired with a reduction in promoter ownership. The accompanying chart clearly demonstrates a drop in the promoter’s shareholding.
 The influence of these two critical warning signals on the stock’s price movement is vividly demonstrated in the accompanying chart below.

Illustrating the Power of Integrating Fundamental Analysis with WD Gann Principles in Stock Evaluation.
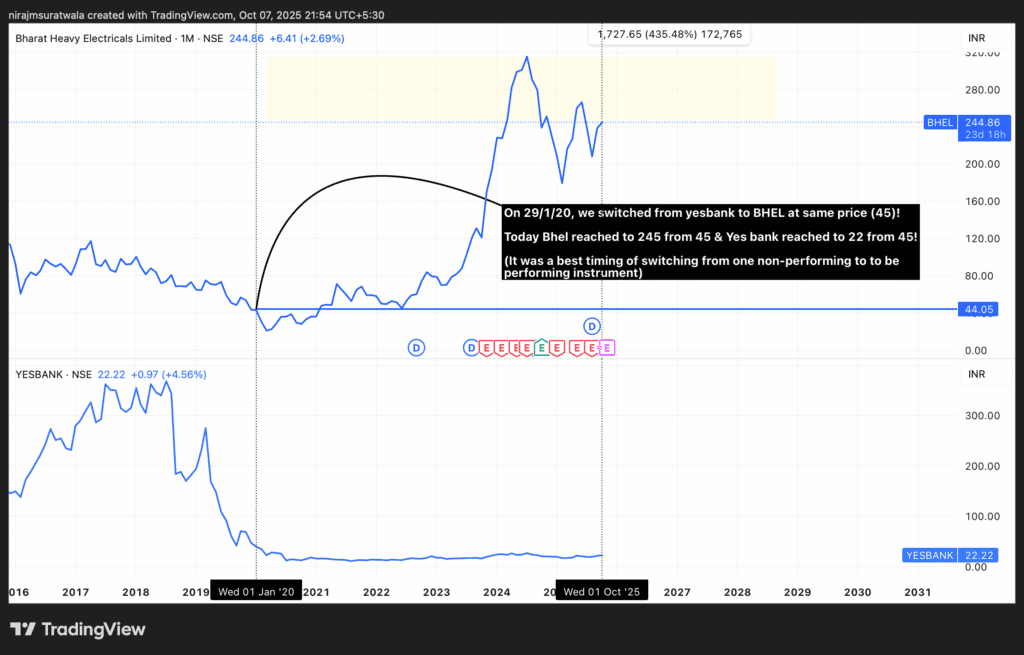
Turning Around a Losing Position: A client of mine was stuck with Yes Bank shares that were racking up heavy losses. I advised them to offload those shares at ₹45 each and redirect the funds into BHEL Ltd., which happened to be priced at the same ₹45 per share during that period.
Core Lesson: When a stock in your portfolio is dragging you down with major declines, it might be wise to exit that position and pivot to another option trading around the same value but with solid prospects for appreciation. This strategy can aid in recouping your setbacks by leveraging the growth trajectory of the replacement investment, transforming a liability into a potential winner.

The results speak for themselves—truly impressive. Currently, BHEL has climbed impressively to the 244 mark from its earlier 45 rupees entry point, whereas Yes Bank remains mired at 22 rupees, a level we strategically divested from at 45 rupees.
In Summary:
By embracing my unique method of fundamental analysis, you’ll be equipped to deliver spot-on market forecasts. Elevate your expertise even further by blending WD Gann theory with rigorous fundamental investigations, unlocking the potential for consistently winning predictions.
My take on WD Gann theory delves into vital fundamentals, including the Gann time cycle, the Gann law of vibration, the Square of 9, and beyond.
To put it simply, mastering the essential techniques can lead to a thriving and lucrative long-term presence in the stock market.